This weeks guest blog post is from Hanna Müller, Vlad Niculescu and Tommaso Polonelli, who are working with Luca Benini at the Integrated Systems Lab and Michele Magno at the Center for Project-Based Learning, both at ETH Zürich. Enjoy!
This blog post will give you some insight into our current work towards autonomous flight on nano-drones using a miniaturized multi-zone depth sensor. Here we will mainly talk about obstacle avoidance, as it is our first building block towards fully autonomous navigation. Who knows, maybe in the future, we will have the honor to write another blog post about localization and mapping ;)
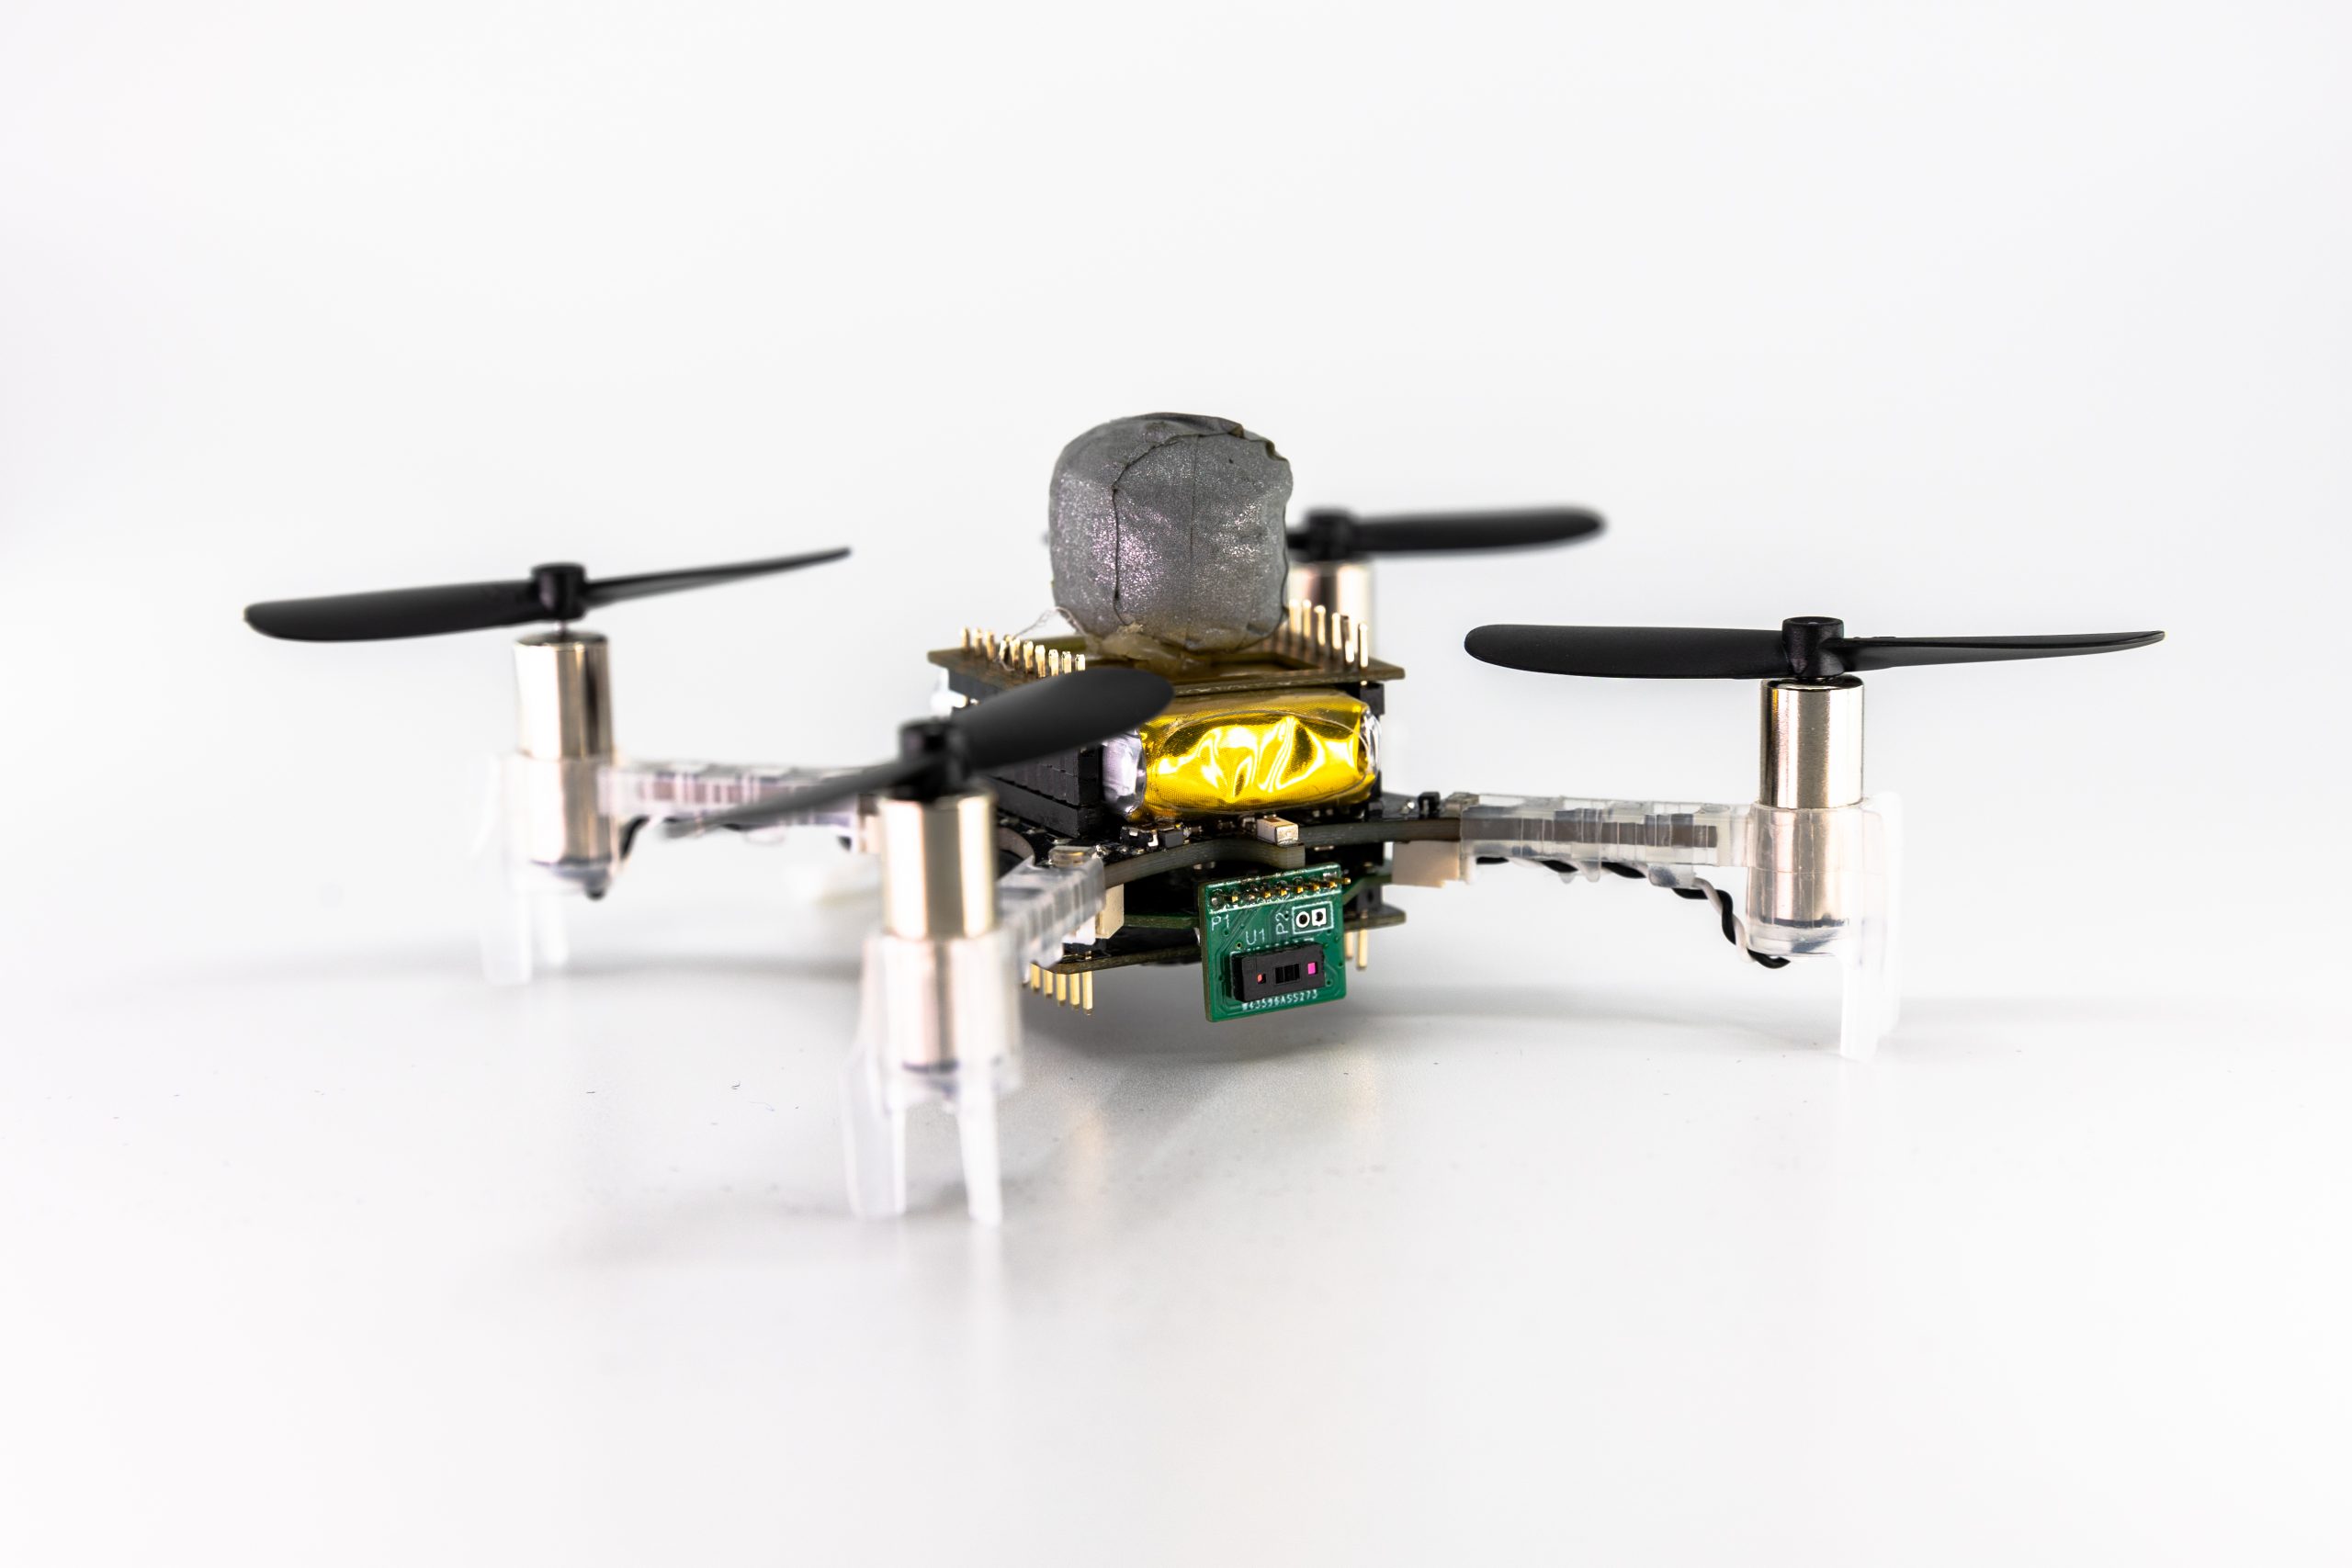
A Crazyflie 2.1 with our custom multi-zone ToF deck, a flow deck and a vicon marker.
Obstacle avoidance on nano-drones is challenging, as the restricted payload limits on-board sensors and computational power. Most approaches, therefore, use lightweight and ultra-low-power monocular cameras (as the AI-deck) or 1d depth sensors (as the multi-ranger deck). However, both those approaches have drawbacks – the camera images need extensive processing, usually even neural networks to detect obstacles. Neural networks additionally need training data and are prone to fail in completely new scenarios. The 1d depth sensors can reliably detect obstacles in their field of view (FoV); however, no information about the size or exact position of the obstacle is obtained.
On bigger drones, usually lidars or radars are used, but unfortunately, due to the limited weight and power consumption, those cannot be carried and used on nano-drones. However, in 2021 STMicroelectronics introduced a new multi-zone Time-of-Flight (ToF) sensor – with maximal 8×8 pixel resolution, a range up to 4m (according to the datasheet), a small form-factor and low power consumption of only 286mW (typical) it is ideal to use on nano-drones.
In the picture on top, you can see the Crazyflie 2.1 with our custom ToF deck (open-sourced at https://github.com/ETH-PBL/Matrix_ToF_Drones). We described this deck for the first time in [1], together with a sensor characterization. From this, we saw that we could use the sensor in different light conditions and on different colored obstacles, but from 2m on, the measurements started to get incomplete in all scenarios. However, as the sensor can detect invalid measurements (due to interference or obstacles being out of range), we can still rely on our information. In [2], we presented the system and some steps towards obstacle avoidance in a demo abstract, as you can see in the video below:
The next thing we did was to collect a dataset – we flew with different combinations of decks (flow-deck v2, AI-deck, our custom multi-zone ToF deck) and sometimes even tracked by a vicon system. Those recordings amount to an extensive dataset with depth images, RGB images, internal state estimation and the position and attitude ground truth.
We then fed the recorded data into a python simulation to develop an obstacle avoidance algorithm. We focused on only the ToF data (we are not fusing with the camera in this project, we just provide the data for future work). We aimed for a very efficient solution – because we want it to run on-board, on the STM32F405, with low latency and without occupying too many resources. Our algorithm is very lightweight but highly effective – we divide the FoV in different zones, according to how dangerous obstacles in those areas are and then use a decision tree to decide on a steering angle and velocity.
With only using up 0.31% of the computational power and 210 μs latency, we reached our goal of developing an efficient obstacle avoidance algorithm. Our system is also low-power, the power to lift the additional sensor with all accompanying electronics as well as the supply of it totals in less than 10% of the whole drone. On average, our system reaches a flight time of around 7 minutes. We refer to our preprint [3] for details on our various tests – they include flights with distances up to 212 m and 100% reliability and high agility at a low speed in an office environment.
As our paper is currently submitted but not yet accepted our code and dataset are not yet released – however, the hardware design is already accessible: https://github.com/ETH-PBL/Matrix_ToF_Drones
[1] V. Niculescu, H. Müller, I. Ostovar, T. Polonelli, M. Magno and L. Benini, “Towards a Multi-Pixel Time-of-Flight Indoor Navigation System for Nano-Drone Applications,” 2022 IEEE International Instrumentation and Measurement Technology Conference (I2MTC), 2022, pp. 1-6, doi: 10.1109/I2MTC48687.2022.9806701. [2] I. Ostovar, V. Niculescu, H. Müller, T. Polonelli, M. Magno and L. Benini, “Demo Abstract: Towards Reliable Obstacle Avoidance for Nano-UAVs,” 2022 21st ACM/IEEE International Conference on Information Processing in Sensor Networks (IPSN), 2022, pp. 501-502, doi: 10.1109/IPSN54338.2022.00051. [3] H.Müller, V. Niculescu, T. Polonelli, M. Magno and L. Benini “Robust and Efficient Depth-based Obstacle Avoidance for Autonomous Miniaturized UAVs”, submitted to IEEE, preprint: https://arxiv.org/abs/2208.12624
After a period of bitcrazer-vacations, we are now all back at work. The summer here in Sweden has generally been great. Some of us stayed here to keep the company afloat, and some just stayed afloat on lakes or the sea. The majority vacationed inside of Sweden, but some (could you guess who?) have visited France, Italy, or Greece. We’ve been lucky with a mostly warm and sunny weather, perfect for bathing and grilling. And even though it’s nice to enjoy real summer, it’s still worrying sign though, as Europe is experiencing what could be the worst drought in 500 years.
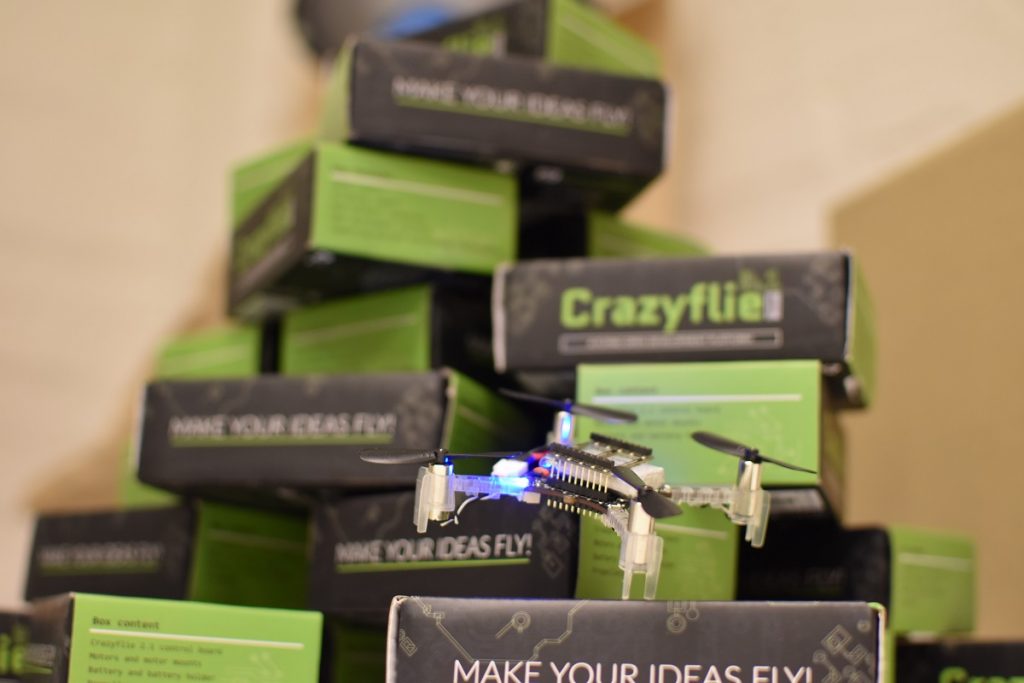
Crazyflie 2.1 back in stock
What is also back is the Crazyflie 2.1, but back in stock, yay! After almost two weeks without any drones available for sale, we received a new batch of our quadcopter today. It should now be available in the shop, just in time for when school starts!
We got some indications the component shortage are slowly moving in the right direction so hopefully it will get easier to keep things in stock in the future. We are keeping our fingers crossed.
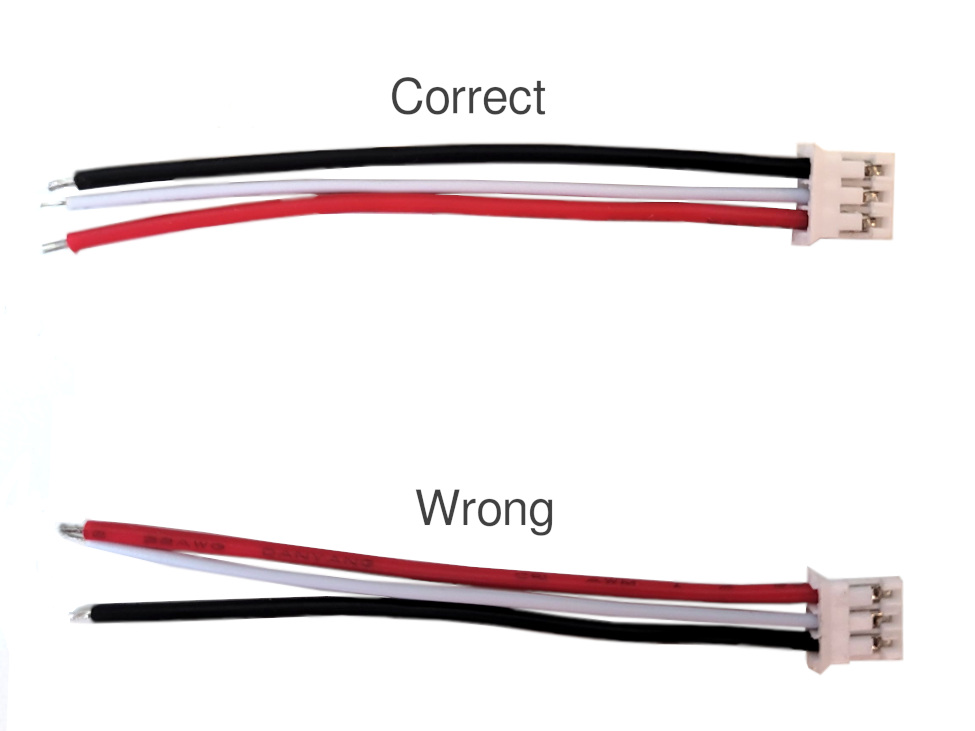
Bolt 1.1 ESC cable red/black switched
Unfortunately we recently found out that there has been a manufacturing error with the ESC cables that come with the Bolt 1.1. The black and red cables have been switched. Please see the image below.
With the black and red cables switched this will result in powering your ESCs with reversed polarity. This will most likely burn the MOSFET on the Bolt that controls the power to the ESC, which is the weakest link. This because the MOSFET body diodes on the ESC will conduct and make the whole ESC a short circuit. In many setups, e.g using 4in1 ESC these cables are not used though and will not cause a problem.
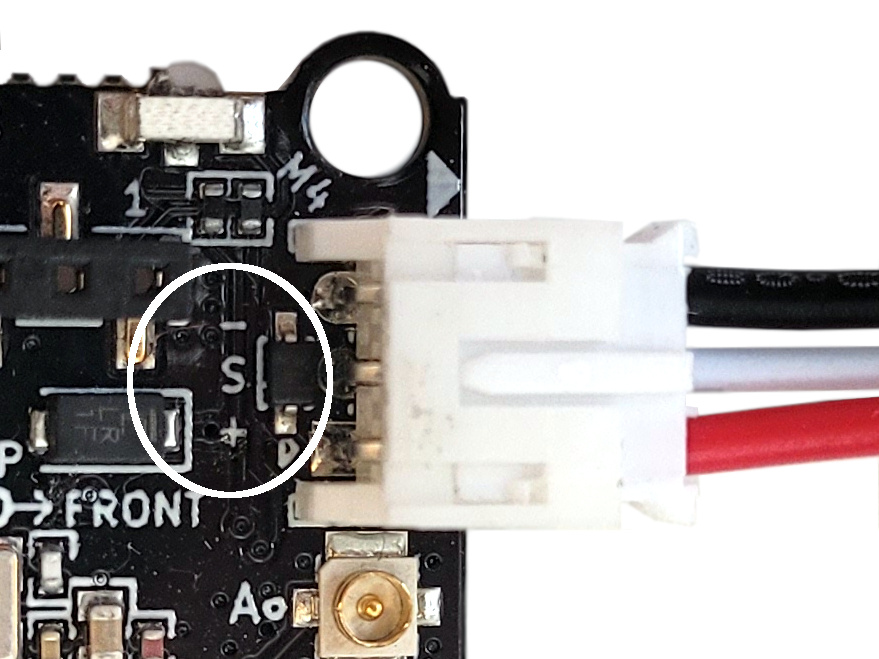
Switching the cables back is quite easy to do. Use a needle, tweezer or e.g. small screwdriver to open the plastic lock so the cable can be pulled out. Switch the black and red and you are done. You can double check that the colors are correct by comparing it with the Bolt 1.1 board. The plus and minus should match with the red and black as per the image below:
We are currently working with the manufacturer to get correct cables. If you got a Bolt 1.1 (anytime between June and August 2022) we can of course ship you correct cables once they are ready or give you support if you got problems with the control board. If so, please send us an email to support@bitcraze.io. Sorry for this inconvenience!
Unmanned Aerial Vehicles (UAVs) have garnered much attention from both researchers and engineers in recent decades. Aerial robots in general are classified into mainly three categories: fixed wings, rotary wings and flapping wings.
Fixed wings are one of the most common aerial vehicles as it has relatively higher power efficiency and payload capacity than other types, thanks to their big and highly customizable wing. But this also leads to a bigger footprint and usually the lack of ability for Vertical Taking Off and Landing (VTOL). Rotary wings generally include helicopter and multirotors (such as quadrotors), and they have recently become increasingly popular in our daily lives. Easily achieving great performance in attitude and position control, rotary wings are widely applied in many fields. Flapping wing robots take inspirations from small flapping insects (such as Harvard Robobee) or birds (Purdue Hummingbird Robot).
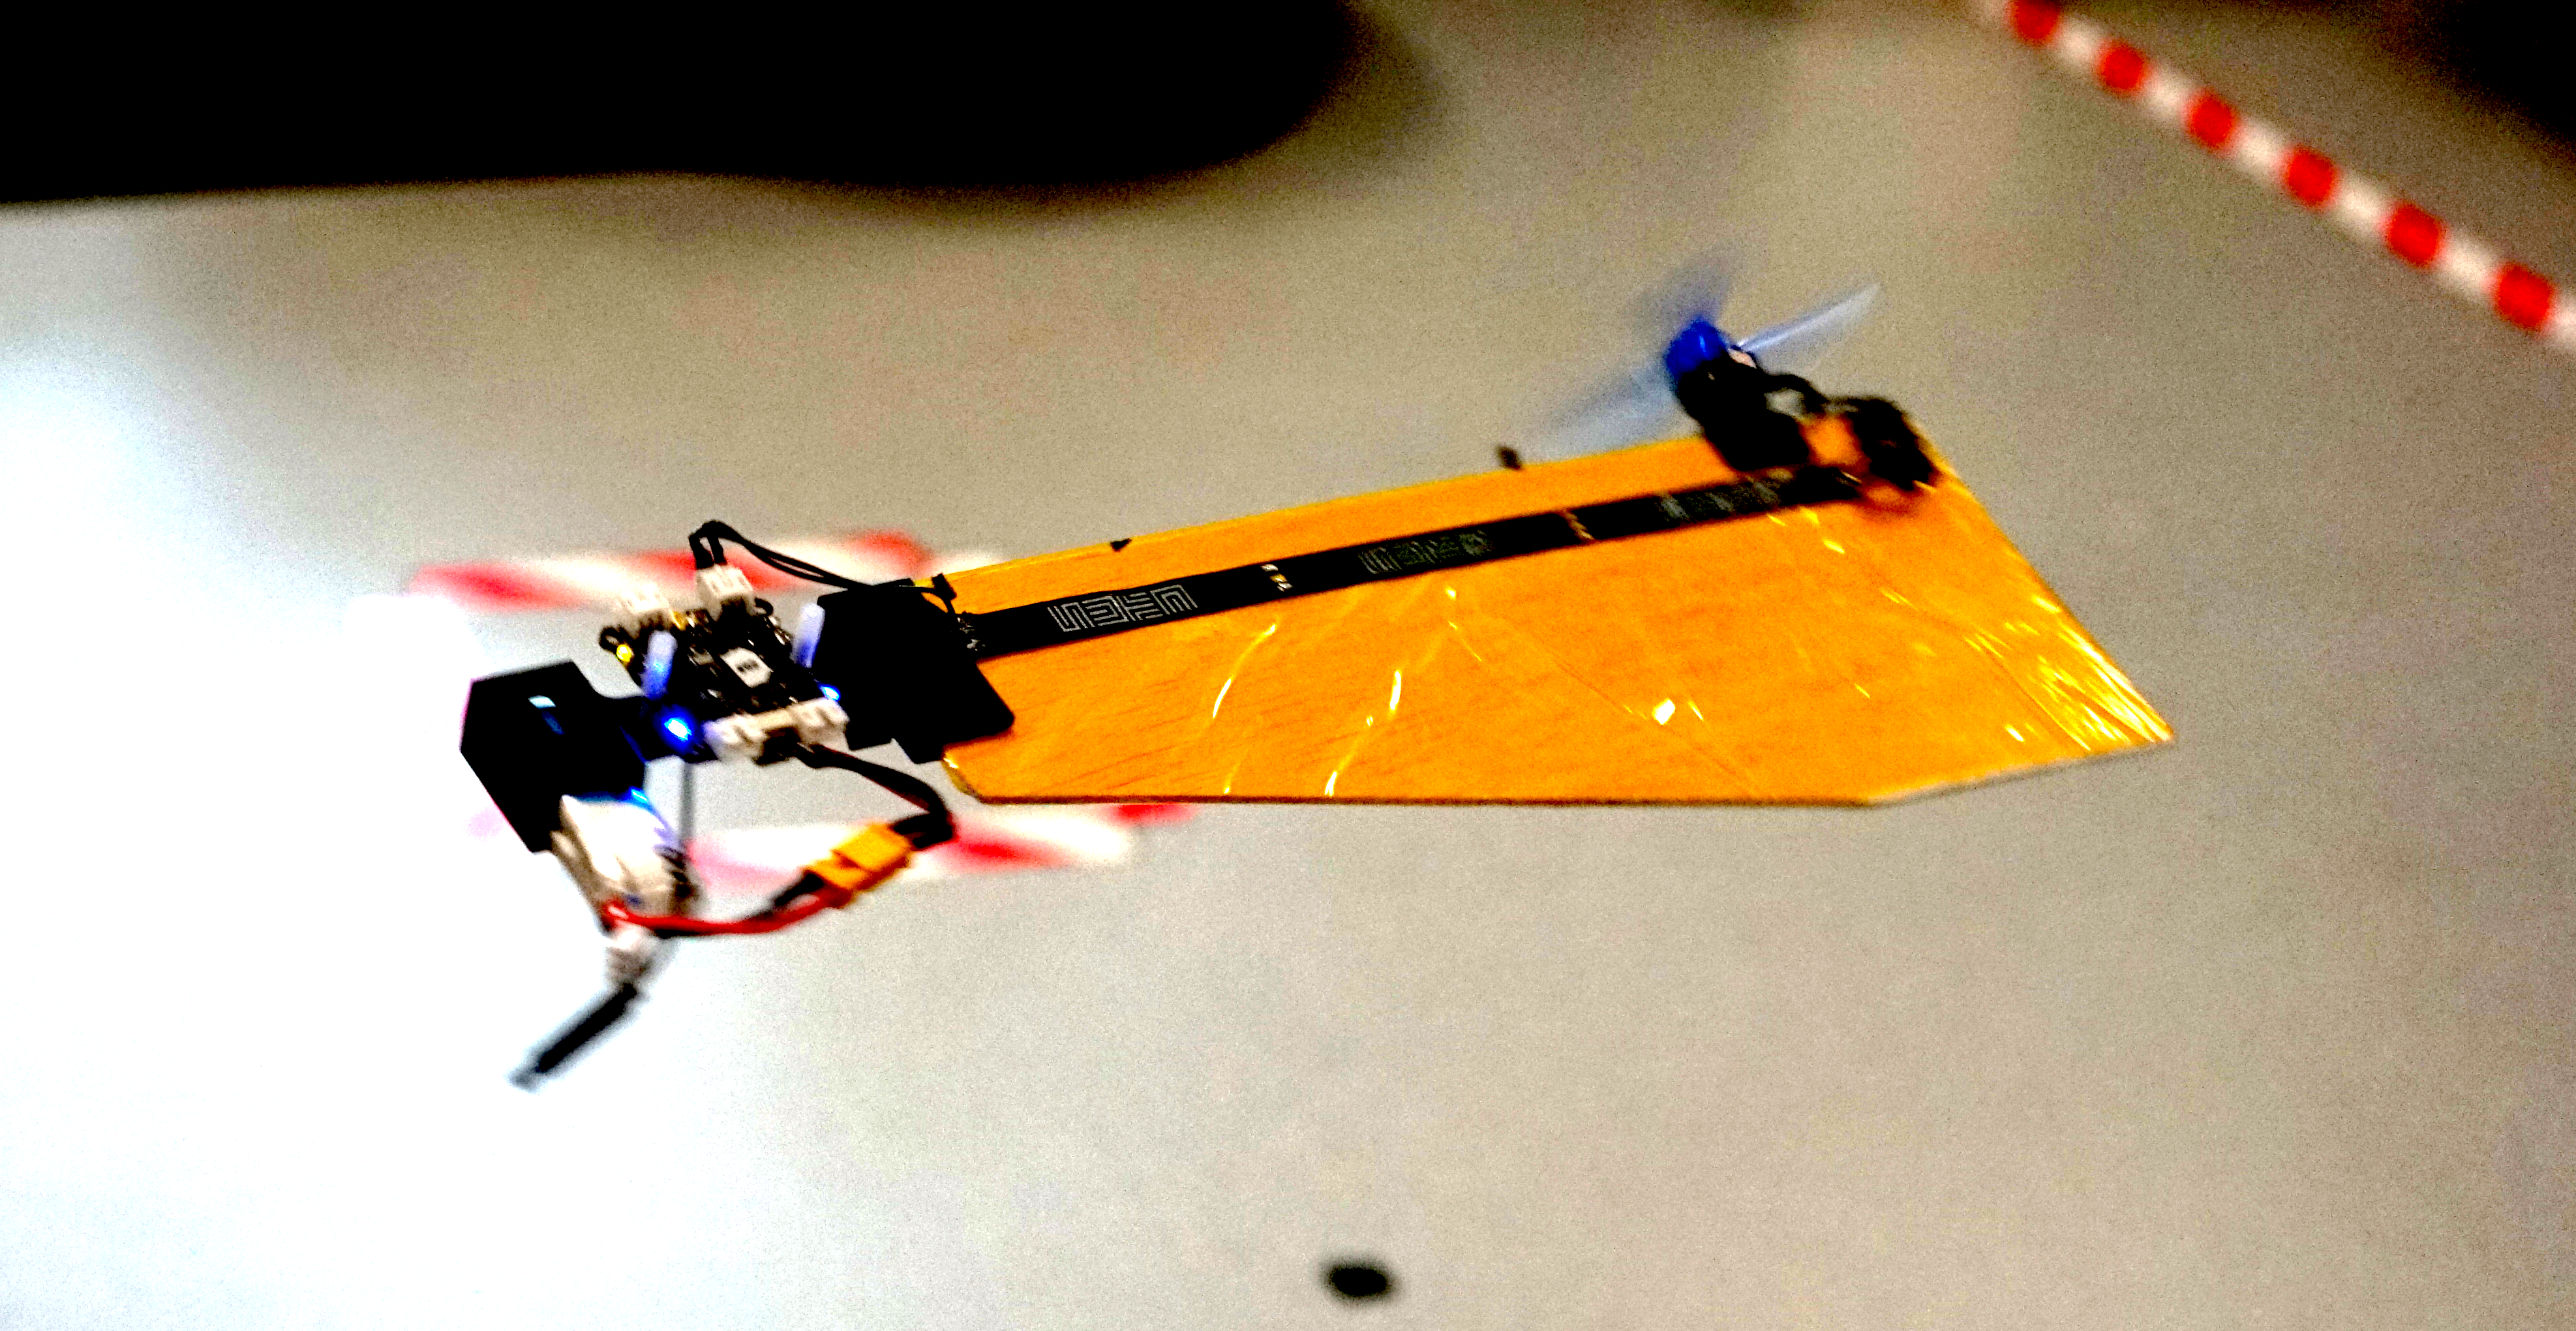
Fig: A simple prototype of SAM from SUTD with Crazyflie Bolt.
Monocopters are largely inspired from the falling motion of maple seeds, and they are relatively much simpler to build as compared to its counterparts. They can keep a relative smaller footprint and achieve decent control performance although they are highly underactuated. The Single Actuator Monocopter (SAM) has the ability to VTOL, perform 3D trajectory tracking as well as maintain high hovering efficiency. With those advantages, rapid developments have been made in recent years such as the Foldable Single Actuator Monocopter (F-SAM) and Modular Single Actuator Monocopter (M-SAM) from Engineering Product Development (EPD) of Singapore University of Technology and Design (SUTD).
Taking inspiration from nature – Samara inspired monocopter
A descending samara or maple seed, is able to passively enter auto-rotation motion and stabilize its flight attitude, helping to slow down its descent speed and travel further for better survival of the species. This natural behavior attracts interests from scientists and researchers. With previous studies, we learnt that this passive attitude stability is mainly guaranteed by mass distribution (Center of Mass) and wing geometry (Center of Pressure) as well as the rotation motion.
A maple seed inspired Single Actuator Monocopter (SAM).
The SAM is designed to be very close in its mechanical make-up to its natural sibling, having a large single wing structure and a smaller, denser ‘seed’ structure. A single motor with propeller is installed on the leading edge, parallel to the wing surface. Comparing with flight dynamics of the original maple seed, SAM has extra torques and force caused by the spinning propeller, including a reaction torque and thrust directly from propeller, as well as an extra torque caused by precession motion. As a result, the balance of the combined forces and torques allows SAM to enter a new equilibrium condition while still retaining the passive attitude stability.
Development of monocopters
The research on monocopters can be traced back to a long time ago. Here are some examples of different types of air frame to roughly introduce their developments. An air-frame called Robotic Samara [1] was created in 2010, which has a motor to provide rotational force, a servo to control collective pitch of the wing, a winged body fabricated by carbon fiber, and a lipo battery. In the following year, Samarai MAV [2] was developed by following the mass distribution of a natural maple seed. To achieve the control, a servo is equipped to regulate the wing flap. In 2020, a single actuator monocopter was introduced with a simplified air-frame [3]. The main structure is made by laminated balsa wood while the trailing edge of the wing is made by foam for better mass distribution. By making use of the passive attitude stability, only one actuator is required to control the position in 3D space. Based on which, F-SAM [4] and M-SAM [5] were developed in 2021 and 2022 respectively.
SAM with foldable wing structure (F-SAM).
A Modular SAM (M-SAM) with Crazyflie Bolt
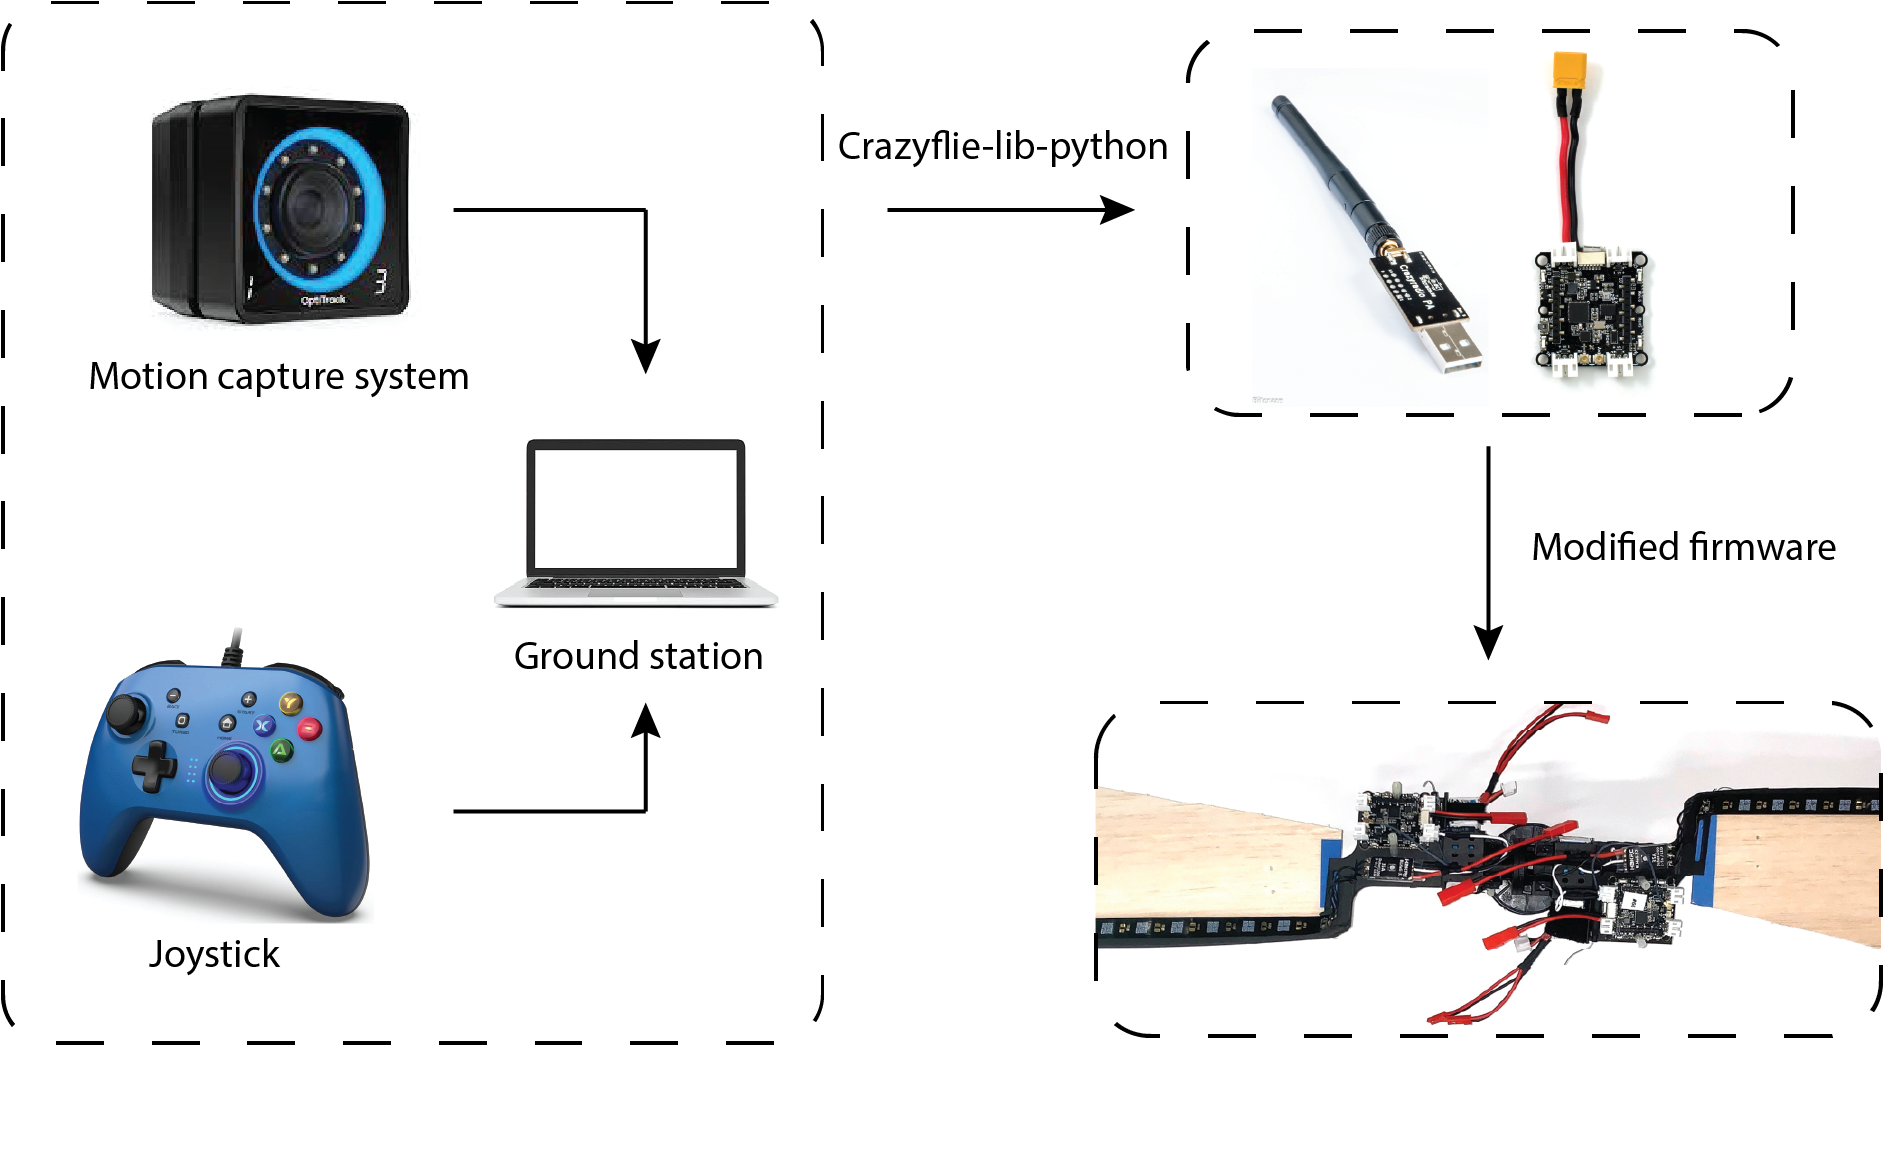
Thanks to its easy implementation and reliable performance, we use the Crazyflie Bolt as the flight controller for M-SAM. Like other robotic systems, the ground station is integrated with motion capture system (position and attitude feedback for both control and ground truth) and a joystick (control reference directly generated by user) is responsible for sending filtered state feedbacks and control references or control signal directly to flight controller. This is realized by employing the Crazyradio PA under the Crazyflie-lib-python environment. Simple modifications from the original firmware were made to map from the control reference to motor command (a customized flight controller).
A diagram shows how Crazyflie Bolts work in M-SAM project.
Another advantage of using Crazyflie Bolt in M-SAM project is its open source swarm library. Under the swarm environment, SAMs can fly in both singular and cooperative configurations. With simple human assistance, two SAMs can be assembled into cooperative configuration by making use of a pair of magnetic connectors. The mid-air separation from cooperative configuration to singular configuration is passively triggered by increasing the rotating speed until the centrifugal force overcomes the magnetic force.
Modular Single Actuator Monocopters (M-SAM), which is able to fly in both singular and cooperative configuration.
Potential applications
What kinds of applications can be achieved with the monocopter aerial robotic platform? On the one hand, many applications are limited by the nature of self-rotation motion. On the other hand, the passive rotating body also offers advantages in some special scenarios. For example, SAM is an ideal platform for LIDAR application, which usually requires the rotating motion to sense the environment around. Besides, thanks to simple mechanical design and cheap manufacturing cost, SAM can be designed for one time use such as light weight air deployment or unknown, dangerous environments.
An example [6] shows the potential applications of a rotating robot with camera.
Reference
[1] Ulrich, Evan R., Darryll J. Pines, and J. Sean Humbert. “From falling to flying: the path to powered flight of a robotic samara nano air vehicle.” Bioinspiration & biomimetics 5, no. 4 (2010): 045009.
[2] Fregene, Kingsley, David Sharp, Cortney Bolden, Jennifer King, Craig Stoneking, and Steve Jameson. “Autonomous guidance and control of a biomimetic single-wing MAV.” In AUVSI Unmanned Systems Conference, pp. 1-12. Arlington, VA: Assoc. for Unmanned Vehicle Systems International, 2011.
[3] Win, Luke Soe Thura, Shane Kyi Hla Win, Danial Sufiyan, Gim Song Soh, and Shaohui Foong. “Achieving efficient controlled flight with a single actuator.” In 2020 IEEE/ASME International Conference on Advanced Intelligent Mechatronics (AIM), pp. 1625-1631. IEEE, 2020.
[4] Win, Shane Kyi Hla, Luke Soe Thura Win, Danial Sufiyan, and Shaohui Foong. “Design and control of the first foldable single-actuator rotary wing micro aerial vehicle.” Bioinspiration & Biomimetics 16, no. 6 (2021): 066019.
[5] X. Cai, S. K. H. Win, L. S. T. Win, D. Sufiyan and S. Foong, “Cooperative Modular Single Actuator Monocopters Capable of Controlled Passive Separation,” 2022 International Conference on Robotics and Automation (ICRA), 2022, pp. 1989-1995, doi: 10.1109/ICRA46639.2022.9812182.
[6] Bai, Songnan, Qingning He, and Pakpong Chirarattananon. “A bioinspired revolving-wing drone with passive attitude stability and efficient hovering flight.” Science Robotics 7, no. 66 (2022): eabg5913.
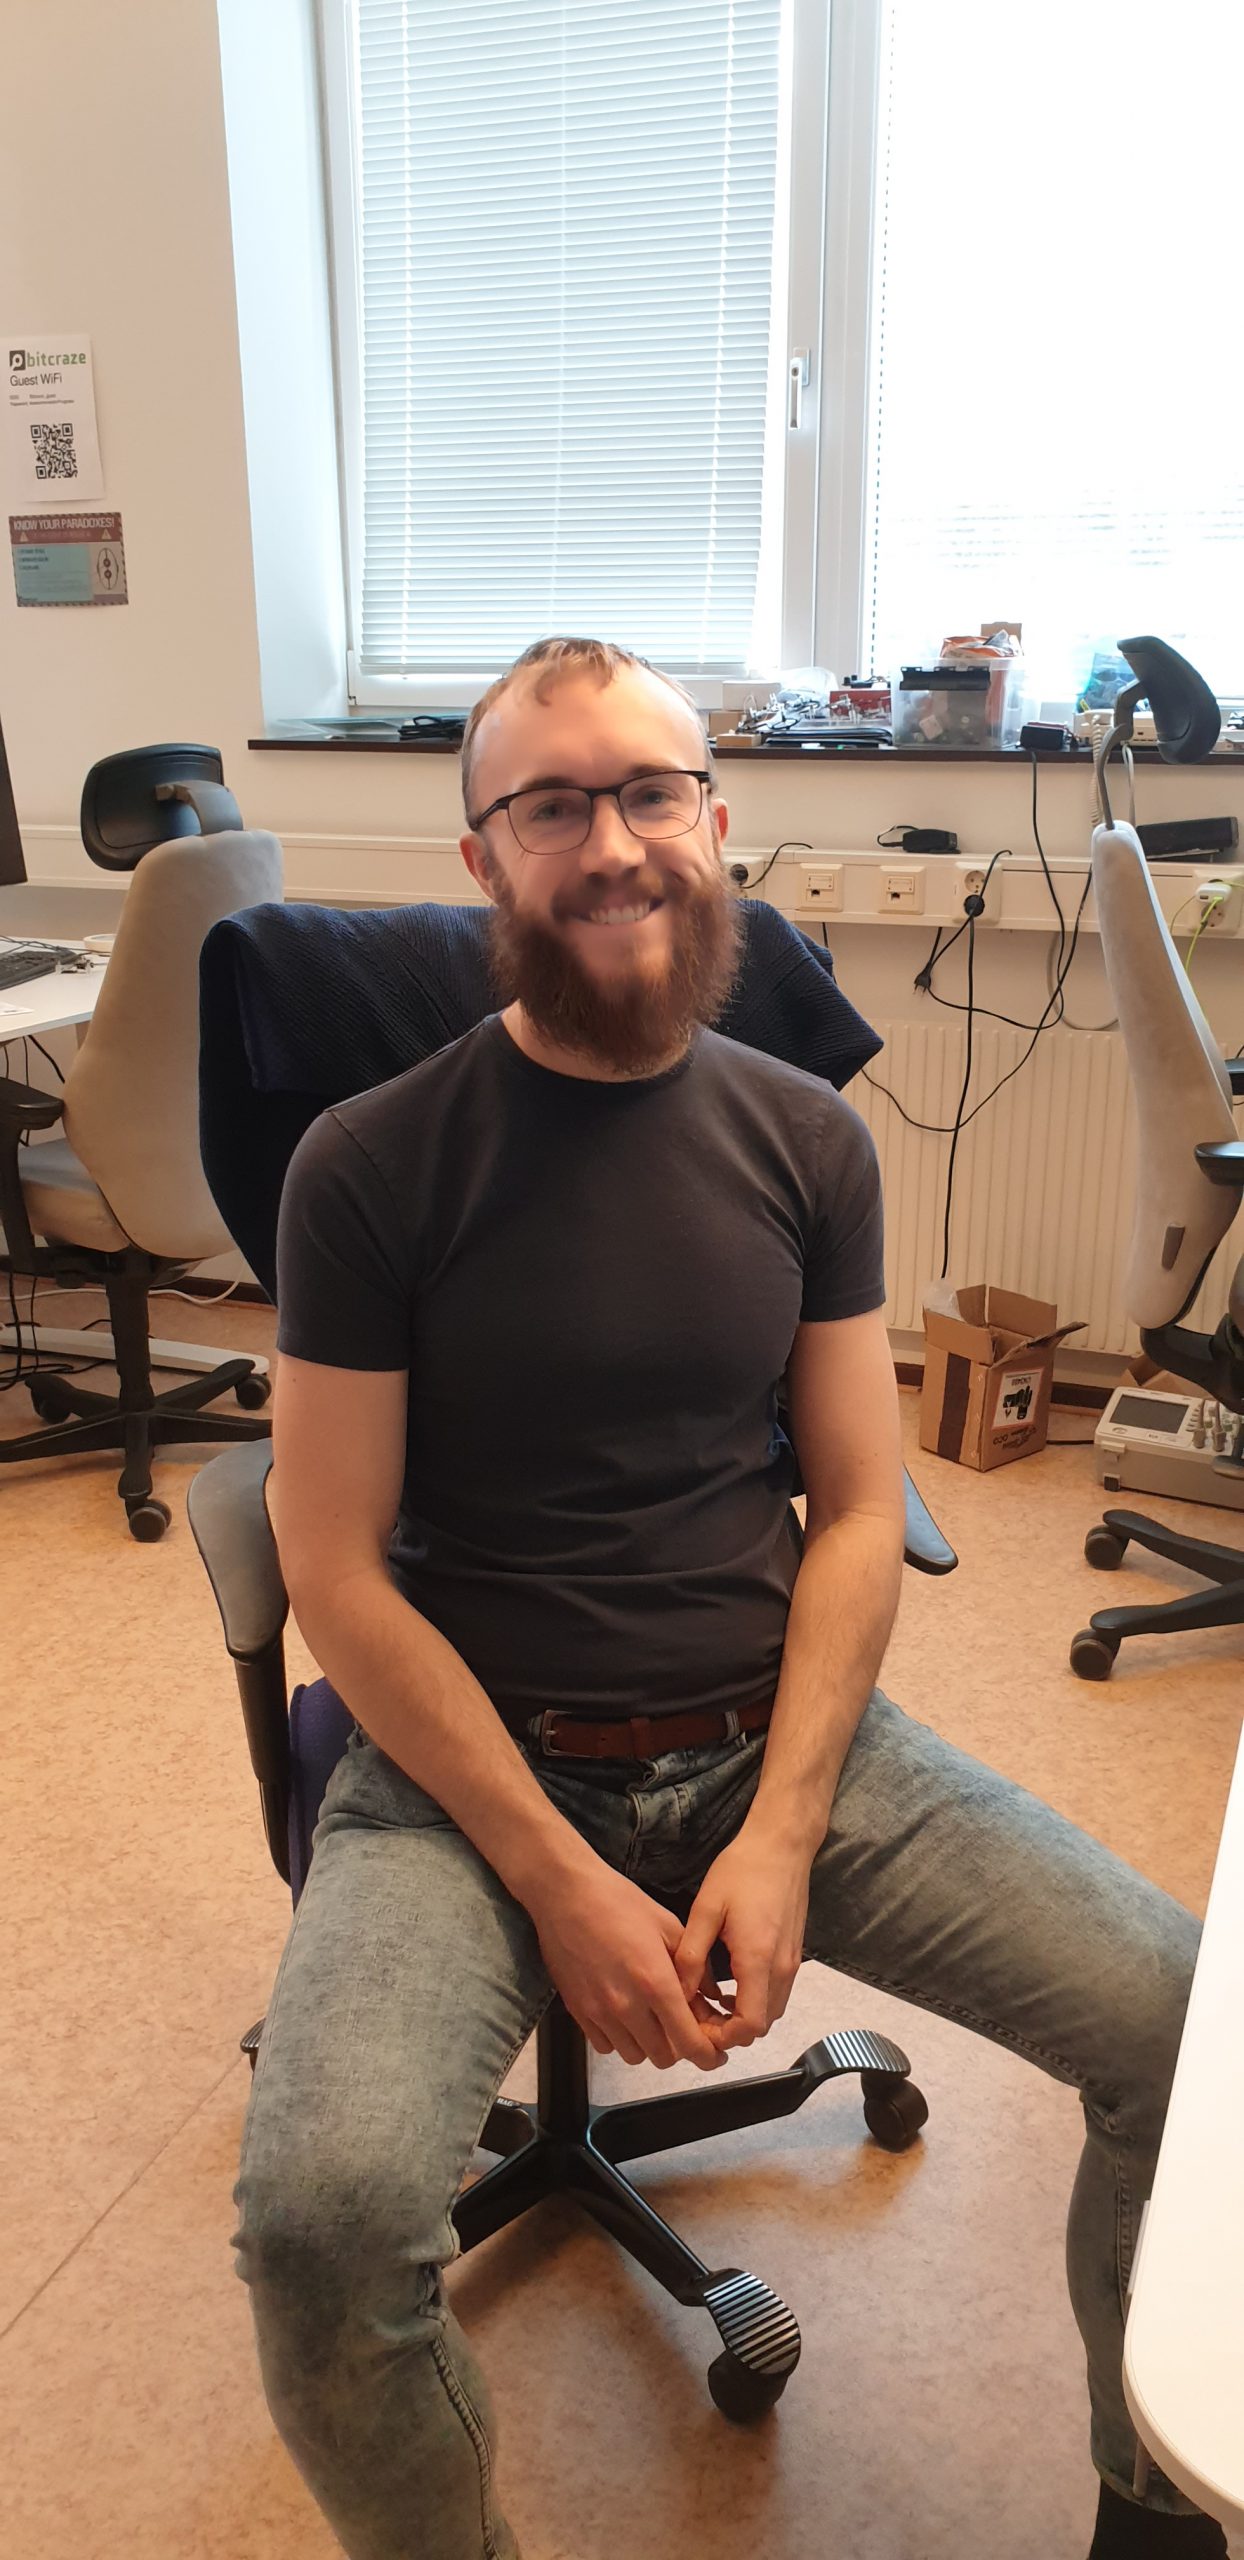
A lot has happened at Bitcraze over the last months, which left us quite short-staffed. Thankfully, Victor has joined us again for a while. He mainly works on finishing his thesis with us, and we all agree that having an extra person at the office feels nice – especially considering the exciting stuff he’s working on! But let’s hear it from him first:
“Hi! I’m Victor, 26 years old, and studying towards a bachelor’s degree in Computer Science and Computer Engineering at LTH. I worked at Bitcraze during the summers of 2019 and 2020 and I’m now doing my bachelor’s thesis here. During this thesis I will make a prototype deck that combines multiple ToF solid state lidar’s (more specifically, the new VL53L5CX). While there exists the Multi-ranger deck today, this new sensor outputs a matrix of distances, which opens up new possibilities that the Multi-ranger can not. Onboard the deck, there will also be an ESP32-S3, which will collect the data from the sensors and then send it to the PC, either through the Crazyflie, or through WiFi. This is all super exciting stuff and has endless potential, so let’s see how far I will get!”
Meet Victor!
I’m sure you will hear more on his progress in the next months, so make sure to keep updated!
Stock issues
We’ve been dealing with the component shortage as good as we can, but production is still unpredictable. Sadly, it means the impact on our stock is too. . The AI deck, the Bolt and the battery chargers are unfortunately out of stock right now. We had to change slightly the Swarm bundles to adjust to the lack of chargers. We’re also low on Multi Rangers, which are expected to run out of stock next week.
All those products are expected back by mid-May, if luck is on our side. It depends on our manufacturer in China, where there is sadly a new Corona outbreak, so it’s not easy to say for sure if this estimation is accurate. We hope that production and delivery stay unimpacted. Just know that we are working on getting everything back on stock as soon as possible. If you want to stay updated on the status of one of our out-of-stock product, you can choose to be informed by mail in our webshop. Just go to the product’s page, and put your email there: you’ll be the first one to know when it’s back in stock !
Keeping things in stock has not been easy the last couple of years due to the general problems with availability of components. We have been mitigating this by increasing stock volumes when it has been possible, but we have also looked at redesigns of some products to be able to switch to other components. A positive side effect has been that it also enabled us to do some small changes we wanted to do for a long time.
The decks we have updated are the Lighthouse, SD-card and BigQuad decks. There are no big functionality changes so the decks have not gotten any updated version only a new board revision.
Lighthouse (Rev.D -> Rev.D1) The outline of the PCB has changed a bit in the hope of protecting the photo-diode sensors a bit better during hard crashes.
SD-card (Rev.C -> Rev.D) Some solder bridges were added to the bottom of the PCB to make it easier to utilize the “hidden” SPI port. This can be useful if wanting to log a lot of values to the SD-card in combination with decks using the SPI port as well, such as the Loco or Flow decks. See the datasheet for more details.
Biq-Quad (Rev.C -> Rev.C1) The capacitor C1 was removed. This was used to filter the analog current measurement reading but also caused problem for the SPI bus on the deck port. The SPI bus turned out to be a more used functionality and therefore capacitor C1 was removed. If the analog filtering functionality is wanted, a 100nF 0603 capacitor can be soldered to C1.
From now on we ship the updated revisions if you order in our store.
Jonas is leaving Bitcraze
We are sad to announce that Jonas is leaving Bitcraze. He has been involved in a lot of Github management, setting up the Crazy Stabilization lab, and various improvements and tools within our eco-system. Although he will be missed, we are excited that he is able to start a new chapter in his live and hope the best for him in his future endeavors.
The semiconductor/electrical components shortage has not gone unnoticed by now, especially with the news coverage it had so far. It’s effecting most industries dealing with electrical components such as car manufacturers, which seem to have an especially hard time. We have been doing our best to handle the crisis, often solving it by throwing money at the problem. When you are a small player like us, you just don’t get prioritized by the big electronics manufacturers, and paying more at the open market is most often the only solution. In the beginning of May this year we had to increase our prices to counteract our increased cost as communicated in this blog post. Hopefully we will not have to increase them more but the shortage is now estimated to last for yet another year or two, and who knows how it eventually will effect us.
Another outcome of the semiconductor shortage is that the manufacturing lead-times has become very long and uncertain, so stock management has become much harder. We have solved it partially by increasing our stock but that also requires capital, which is a limited resource. We think we have managed quite OK so far but as of now Crazyflie 2.1, Multiranger-deck and SD-card decks are out of stock. Crazyflie 2.1 will hopefully arrive at the end of this week and the Multiranger and SD-card decks at the end of December. Even though times are a bit tough right now we are positive and believe we will be able to keep good stock levels throughout the crisis. We might not be able to guarantee that no products will be out of stock, but we can promise to do our very, very best to stay on top of this situation!
During the preparations for BAM, for example the awesome demo that Kristoffer did (link to demo), we had a lot of discussions about landing on charging pads. The Qi deck is a good solution, but the design is a bit complex and makes it hard to have other electronics pointing dowards (although we’ve seen some solutions to this). So after spending a few days thinking about this, I set out to spend a few fun Fridays looking at solutions for this. The results (so far) are detailed in this post.
Contact charger and decks
The idea I decided to try out was something we’ve been discussion on-and-off for a few years, using contact charging instead of Qi. So I revived a few of our old ideas and starting looking for parts. This is always a fun phase of an idea, the sky is the limit! I’m kind of used to electronic parts, but I find looking for mechanical parts is a lot harder. I don’t really have the vocabulary for this and all the parts look the same size in the product photos…
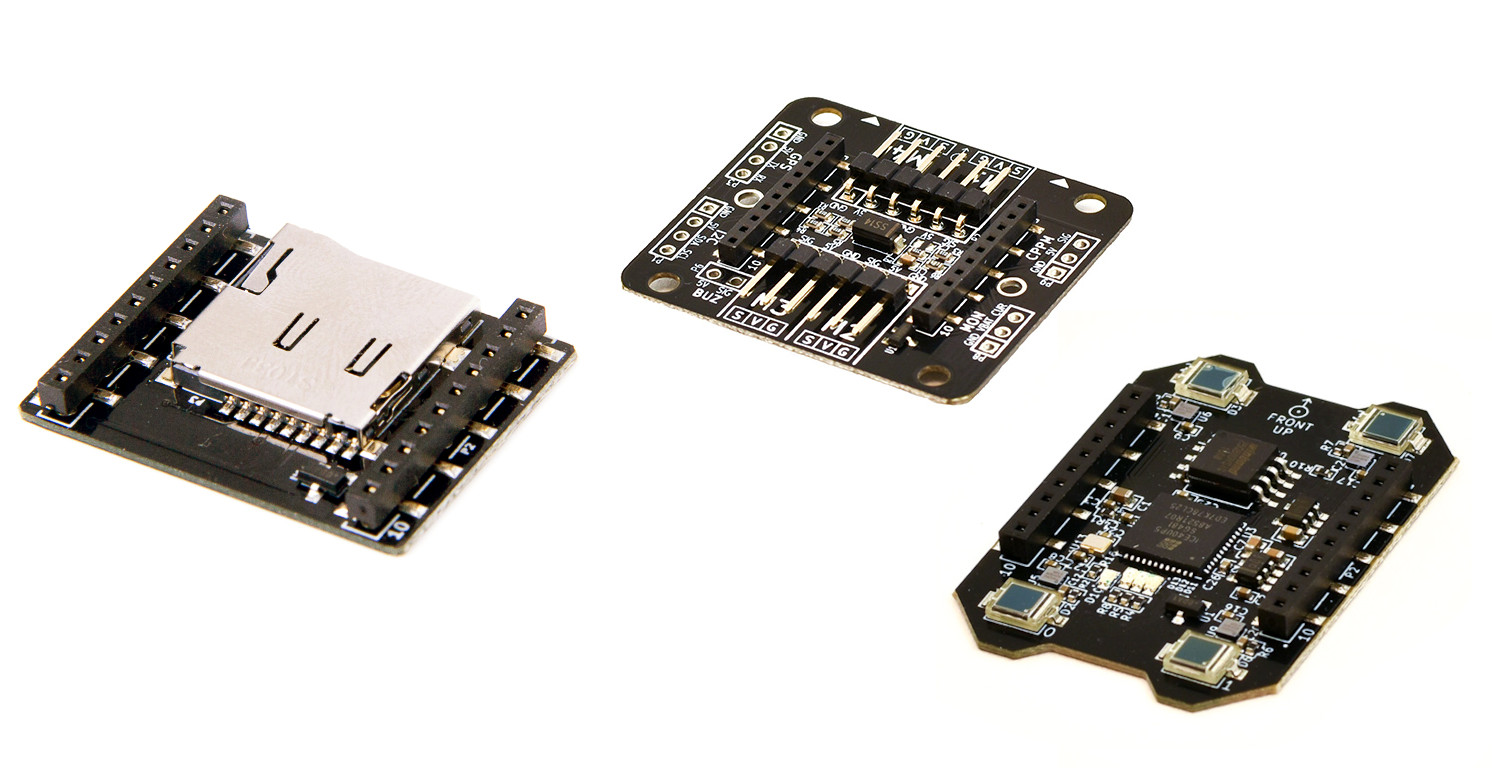
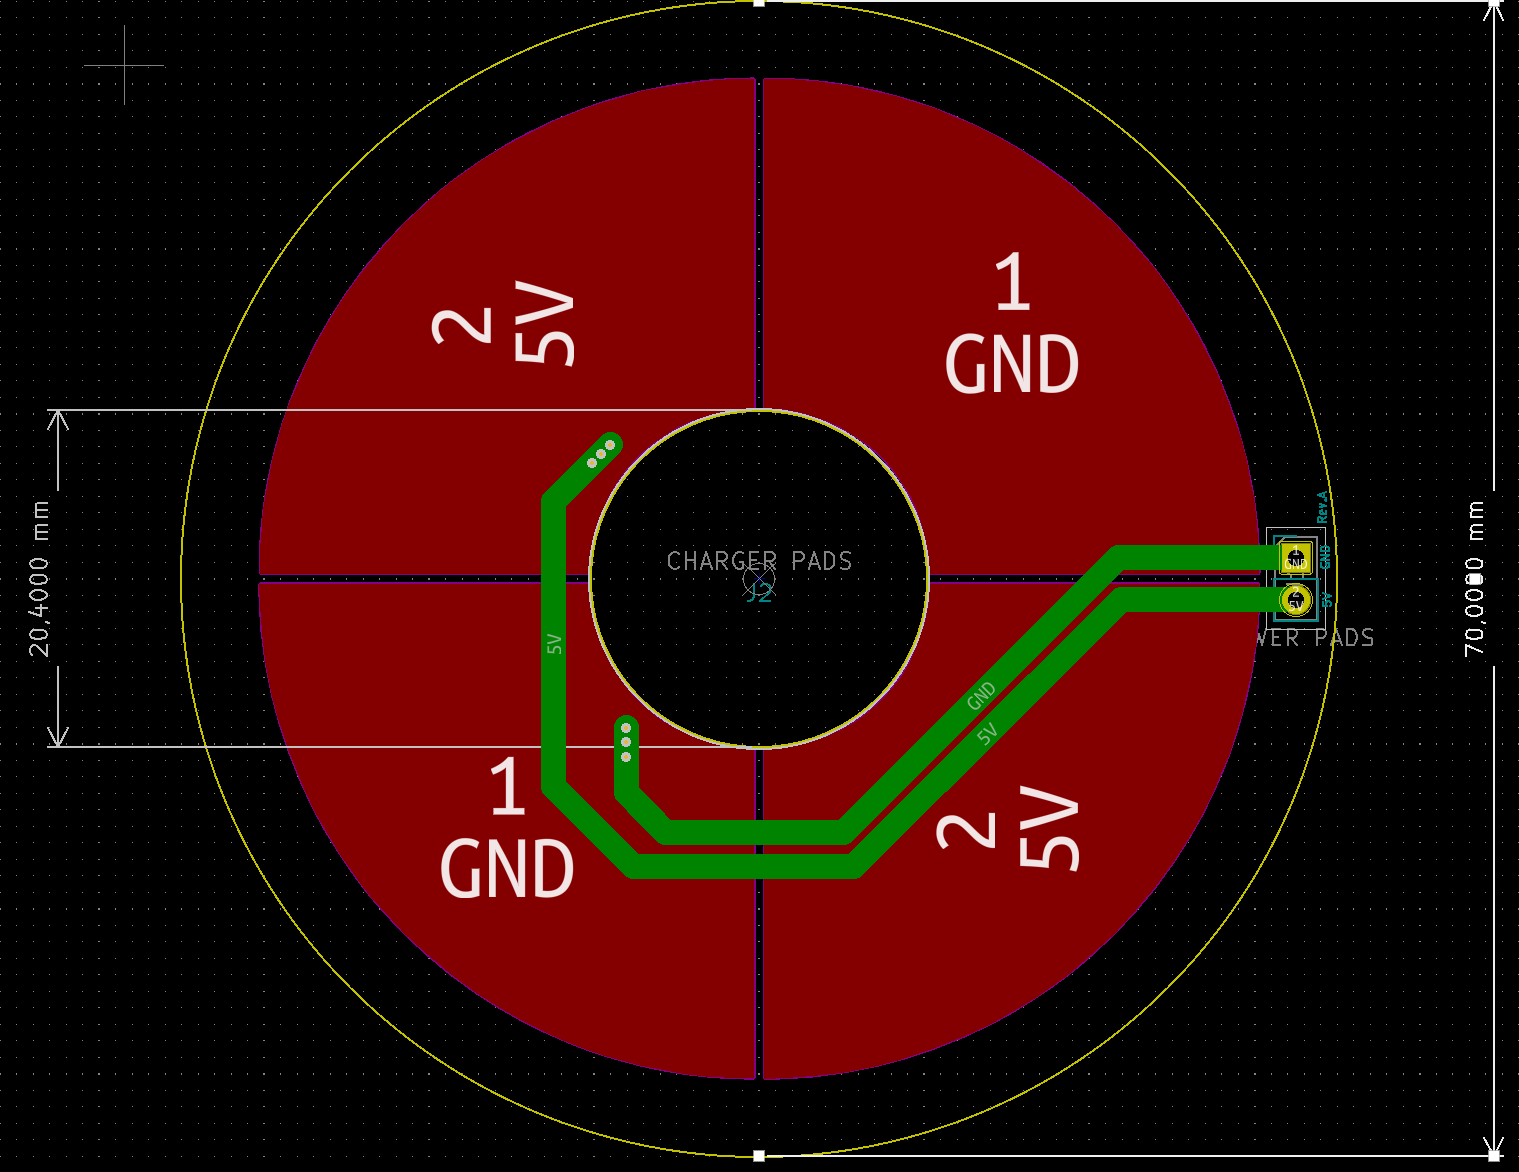
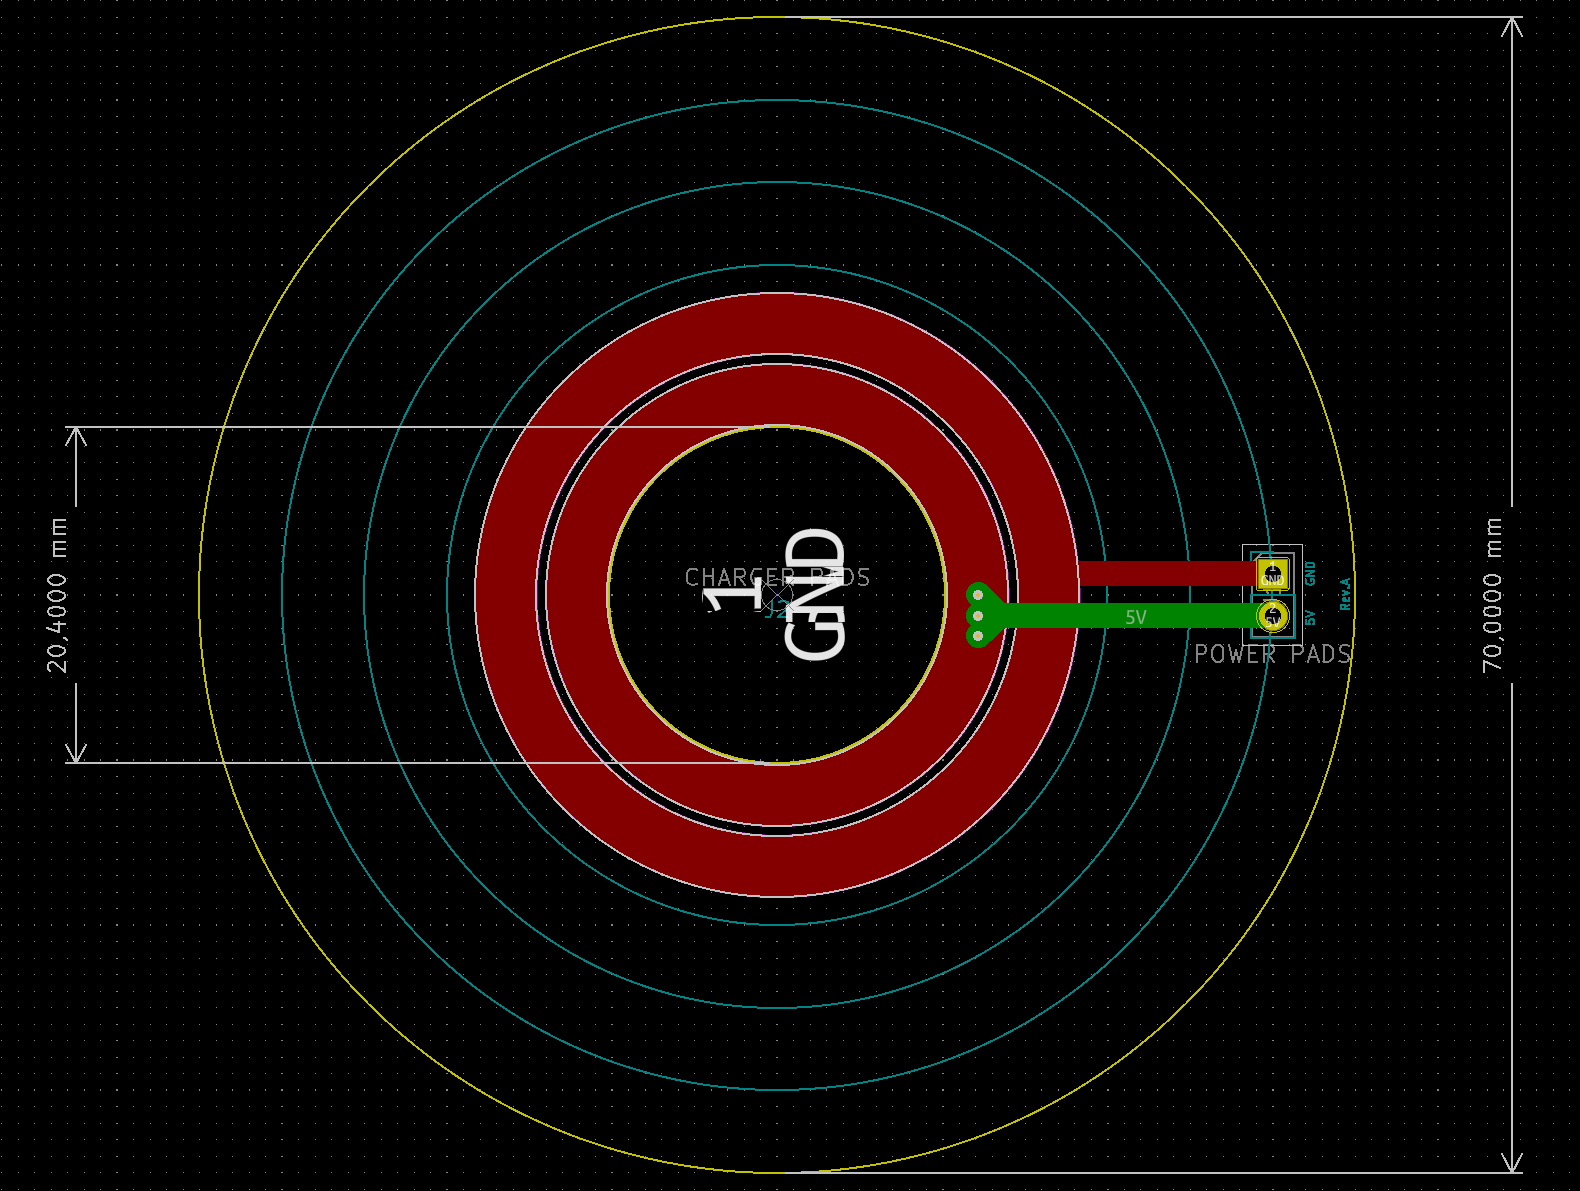
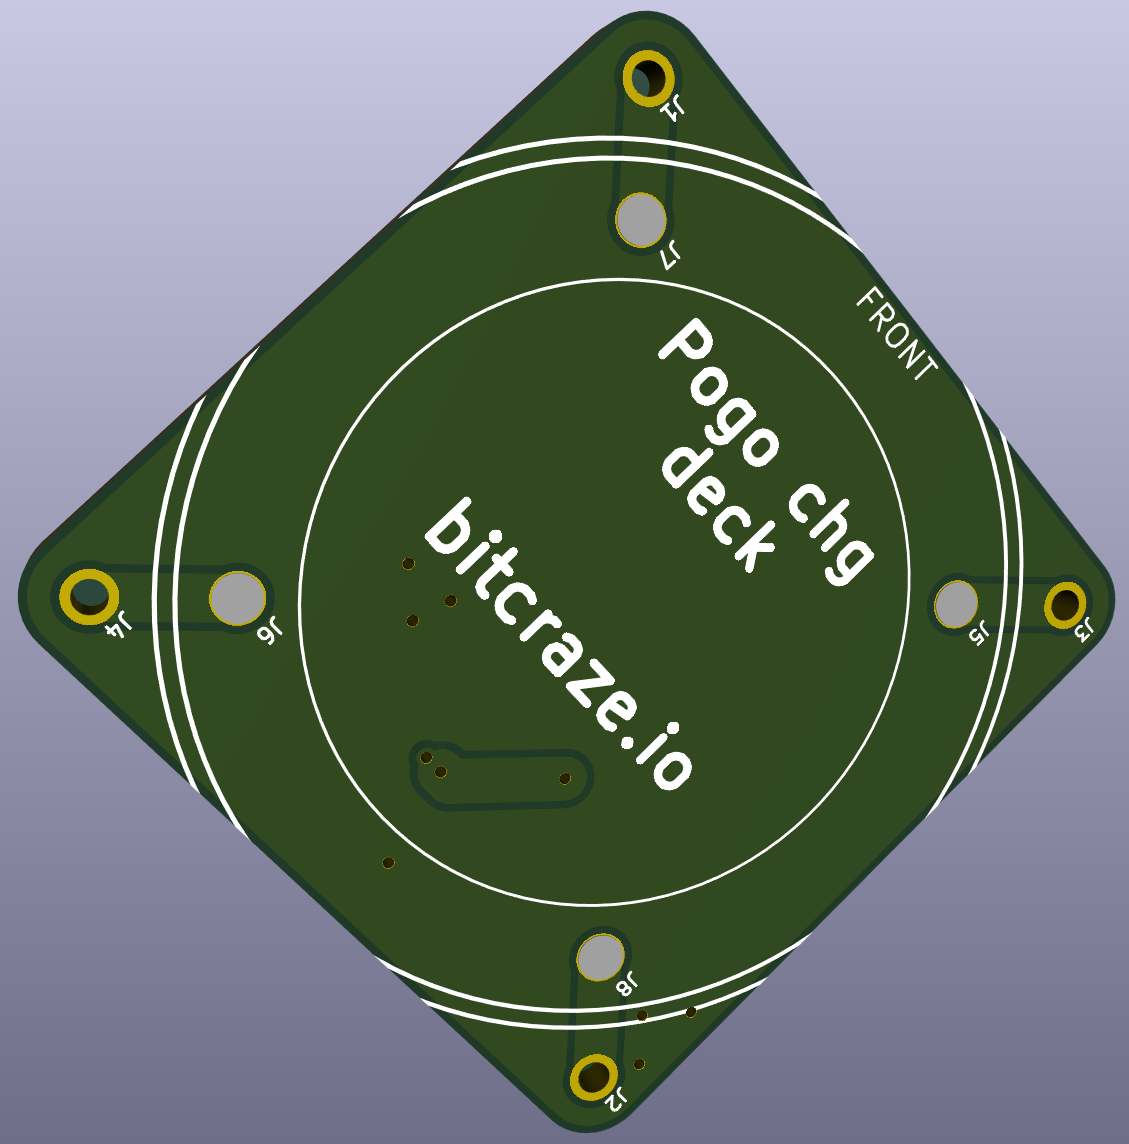
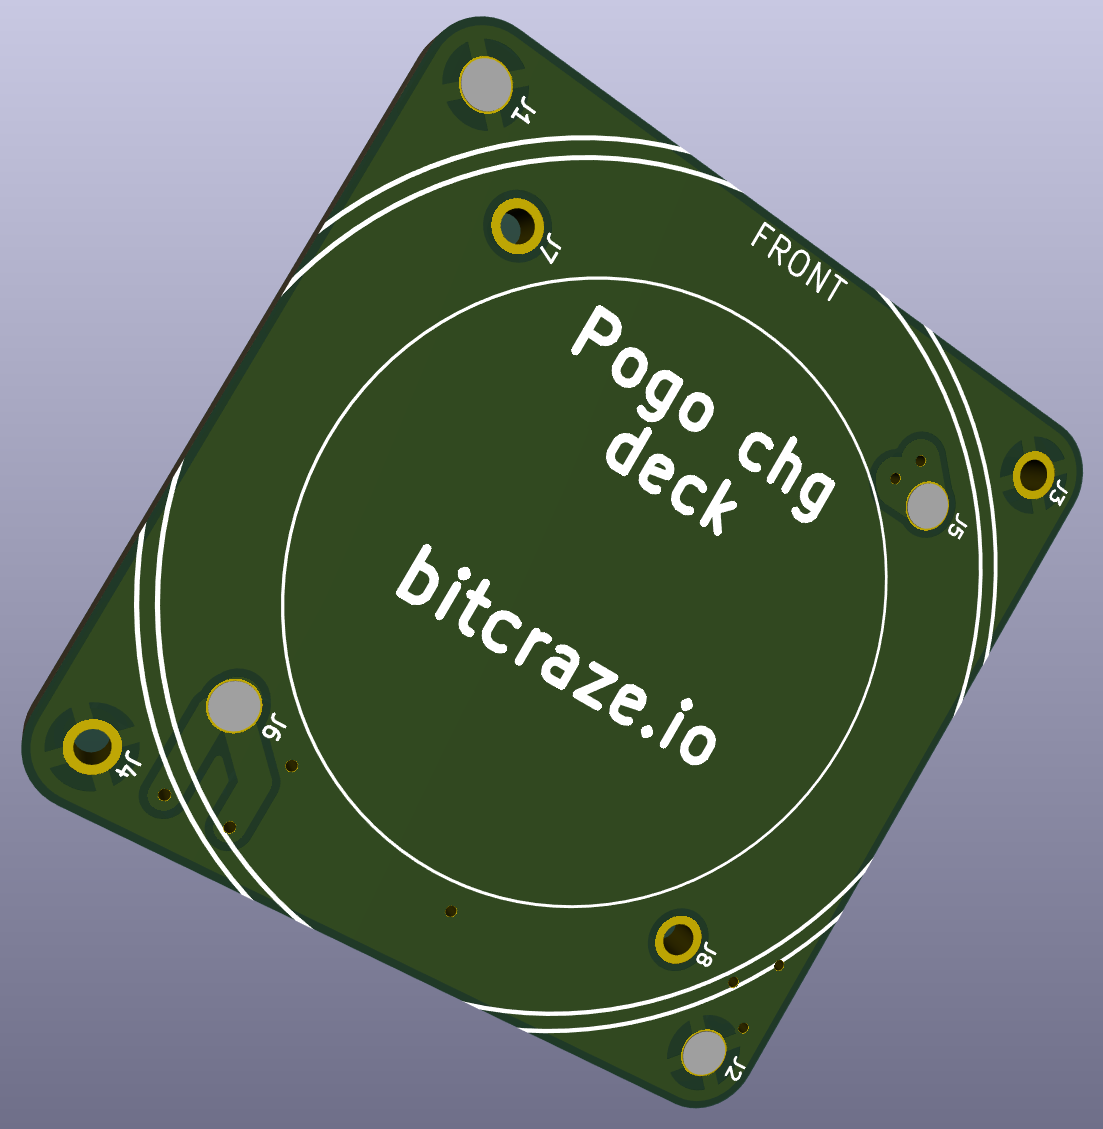
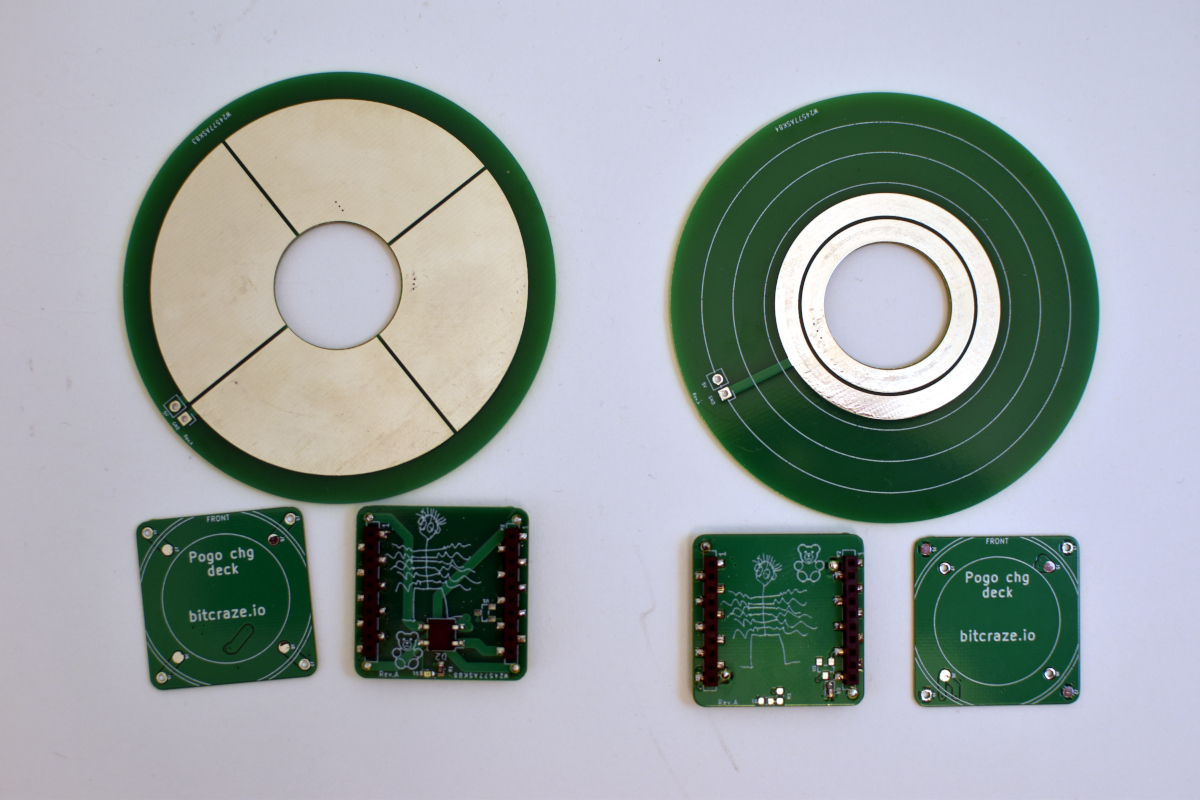
Finally the solution I wanted to test was using small pogo-pins. The idea is that the pogo-pins could be included into any design of new boards and easily enable charging. With the parts found and the ideas fresh again, I jumped into KiCad (5.99) and started the design. Two different designs were made, pictured below.
4 segments (2xGND and 2x5V)
Two circles, one GND and 5V
Why two solutions? I wasn’t sure which one would work well. I suspected the 4 segments would be better, but I was hoping for the two circles, since you would not need additional electronics to handle 5V/GND switched depending on how you landed.
Since there was two solutions for the pad, there’s also two solutions for the deck. I wasn’t sure about what pogo pins to use, so there’s two different sets of pins (which makes it a bit confusing).
Deck for segmented charger (with diode bridge on back)
Deck for circular charger (without diode bridge)
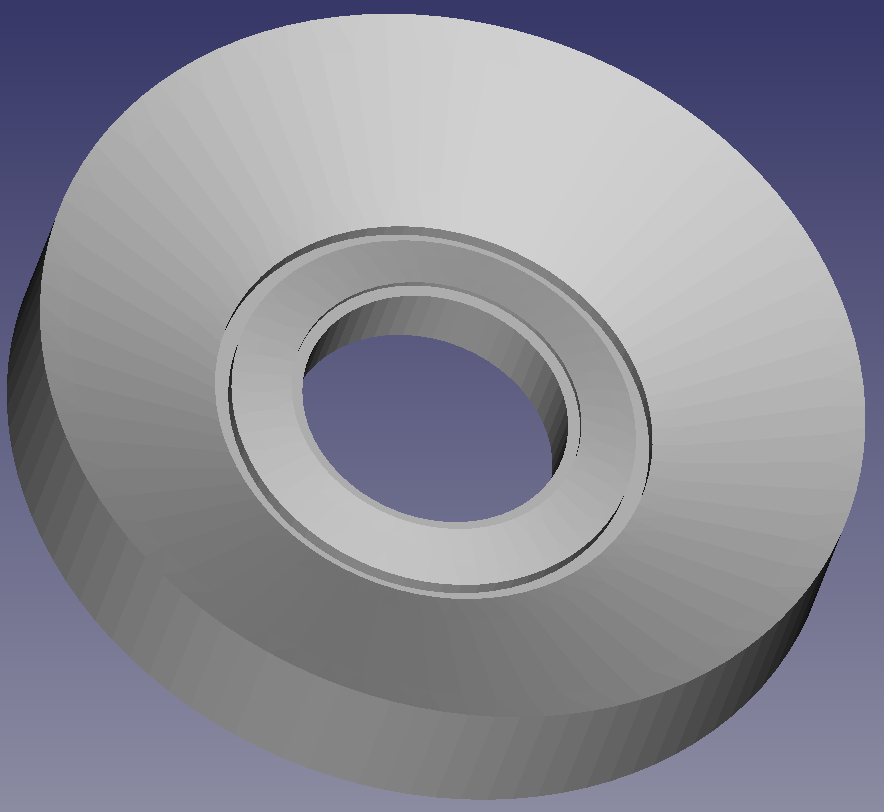
With the components and PCBs in hand I started testing, and…the results were not promising. The design was made to work with our current Qi charging pad (link). Although the alignment for Qi is important, the tolerance was not as tight as what I needed. Back to the drawing board, this time the mechanical one. I used FreeCAD to create a new version where the Crazyflie would align better. After a few iterations with the 3D printer I ended up with this:
Updated charge pad design
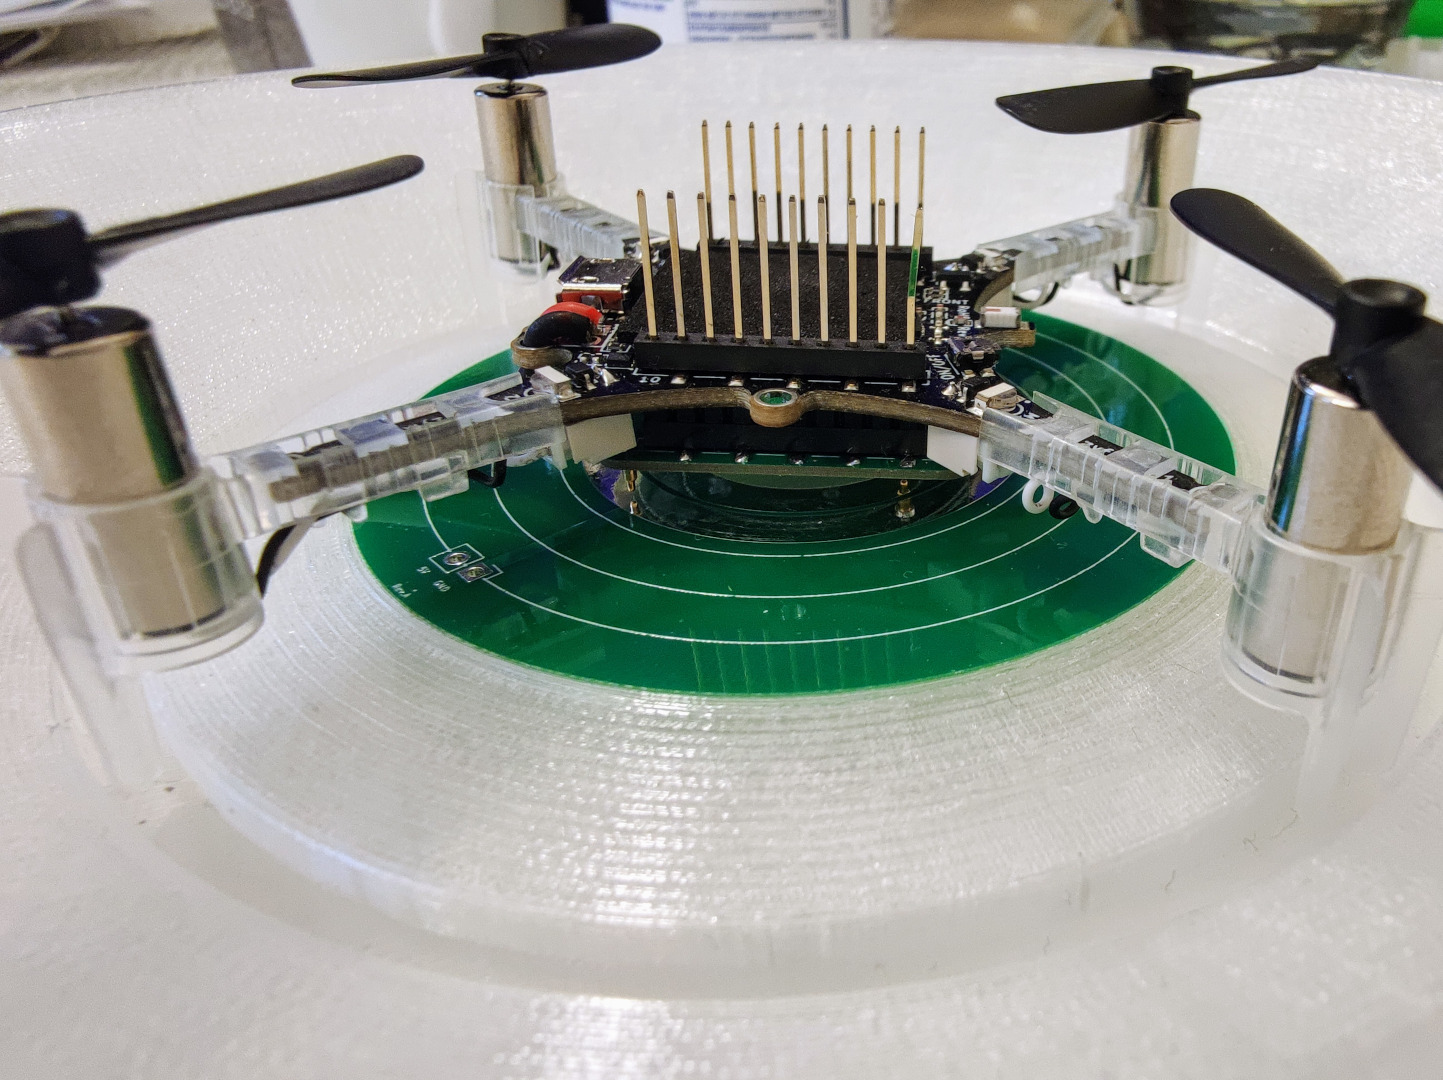
Crazyflie on 3D printed charging pad
Putting it all together, the results were promising. With the new mechanical design the area the Crazyflie can land in is larger and the alignment much better. I think it’s good enough to show that the concept can work. The next step is to look a bit more at the pins, they might be a bit too easy to damage.
Crazyflie on circular charge pad
Charge pads and decks
The Glow deck
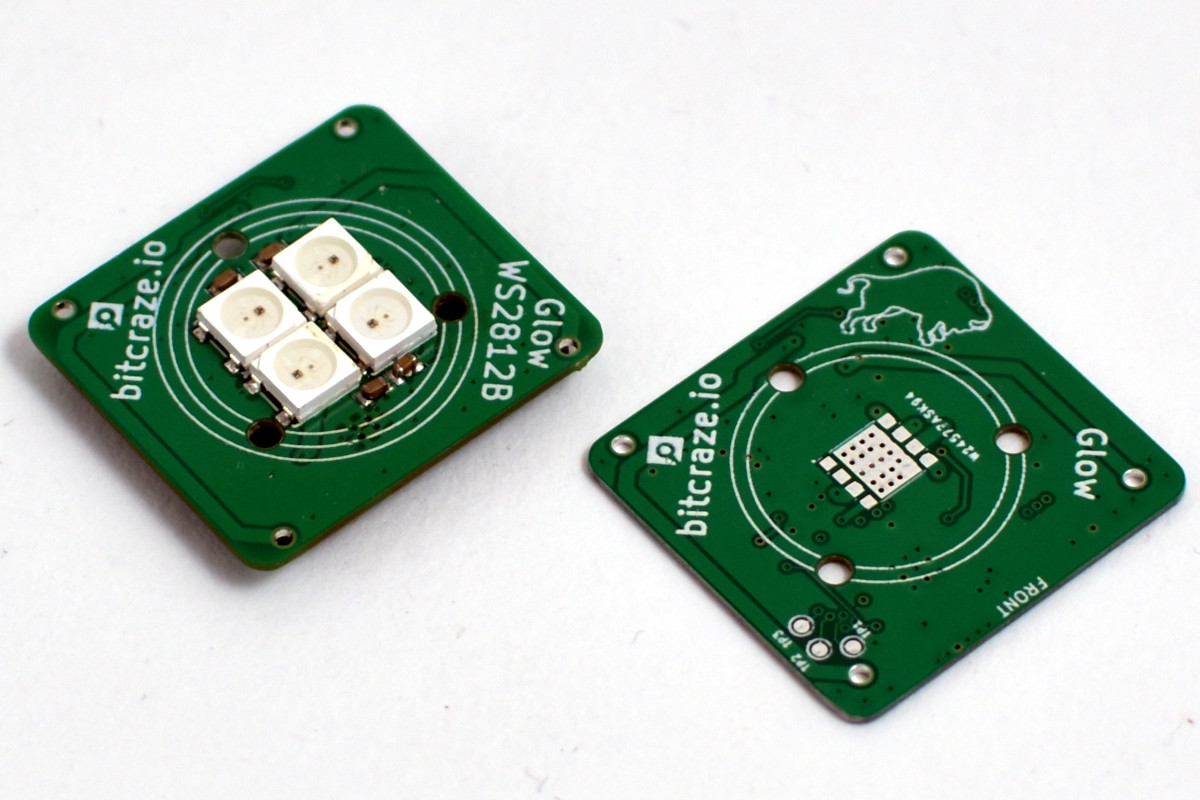
I mentioned above that the idea was to be able to put charging on decks with other designs on them. To test out this concept I revived another old idea, the Glow deck! The Glow deck is a design where the LEDs are visible from the side and also a bit stronger. To achieve this a diffuse lens would be mounted on the PCB.
The first version of the Glow I made was years ago. It contained a high-power LED, which was really bright…and really warm. We stopped measuring the PCB temperature at 140 C, so that wasn’t something that was going to work out. It also only had one color and I wanted more.
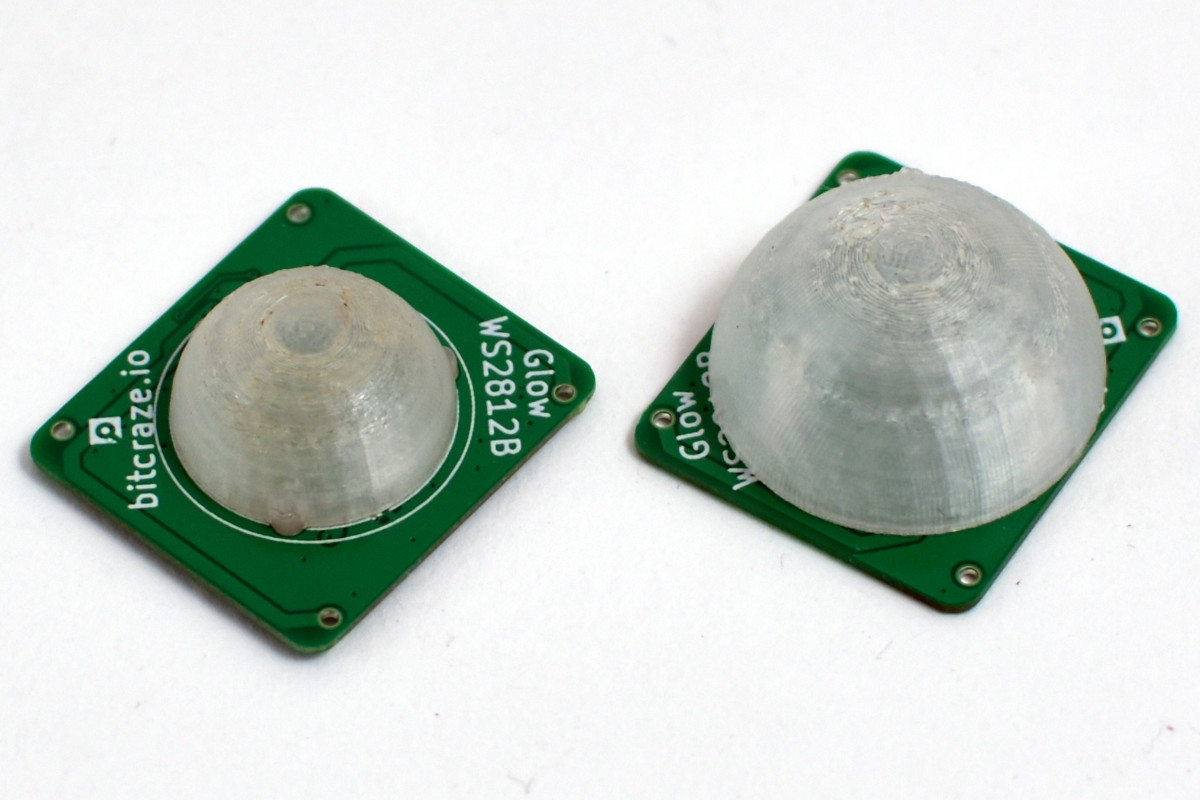
This time around I decided to try two different versions. The reason for the two versions was that I wanted to see if more power actually added something (except complexity and price) when it came to visual effects while flying. One version uses 4xWS2812B LEDs (the same as on the LED-deck) while the other one uses a RGBW high-power LED. I quickly ran into the same problem as with the charging deck, mechanics. I wasn’t able to find a good size of a diffuse lens. Not wanting to be blocked by this I decided on designing one myself and printing it. Not sure how the size would affect the effect I designed two versions.
2 versions of diffuse lens (3D printed)
Left: WS2812B version, right: high-power RGBW version
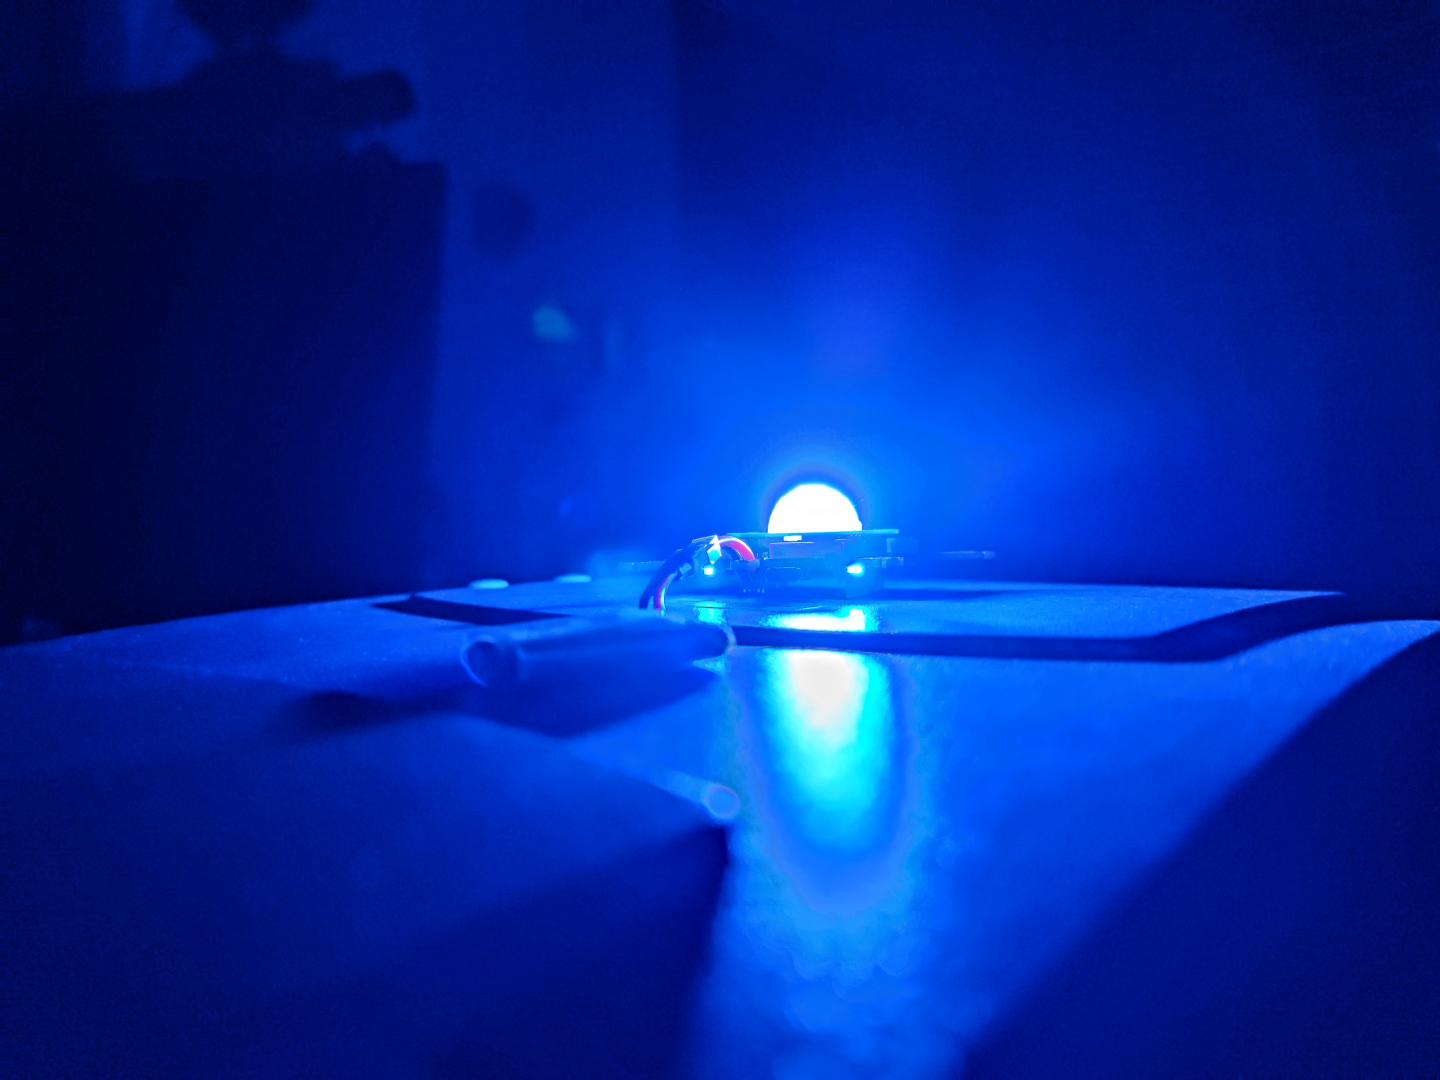
I haven’t had the time to try out the high-power LED version yet, but the results for the WS2812B version with the diffuse lens looks promising. It’s hard to see the effect in the images, but at least it shows that it’s possible to see the LED from the sides.
Conclusions
I think both the contact charging and the Glow looks promising and I’m happy with the results so far. But making one prototype is easy, making something that can be manufactured and properly sourced is different. If any of these ever turn into a product, the challenge will be finding the right pins, lens, charge base etc.
For the next step, I’m excited to see the high-power version of the Glow in action. This time around I’ve added proper dimming and temperature measurement :-) If you have any ideas, comments or questions drop a line below!
Previously we have been using off the shelf scales and other methods to measure characteristics, such as thrust or efficiency, of the Crazyflie products. We thought it was time to build something that is easier to use, more repeatable and tailored to our needs. Well, this has been on our wanted list for a long time, already back from when we did the RPM-deck. It was however first when Wolfgang visited us this winter that he nudged us over the edge so we finally allocated some time for it. We started off by buying some load cells and breakout boards to do something simple as a start, so we could at least measure thrust more easily. We actually started looking for off the shelf thrust stands but could not find anything suitable for the Crazyflie’s size. As is often the case here at Bitcraze, the project grew. Already before we had any load cells up and running I was designing a deck with RPM sensors, load cell amplifier and power meter. Now with the objective to easily do system identification. Therefor we named the deck the system-id deck.
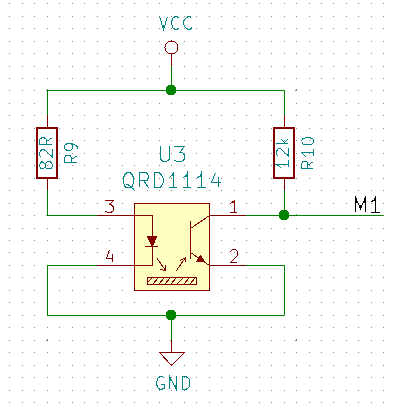
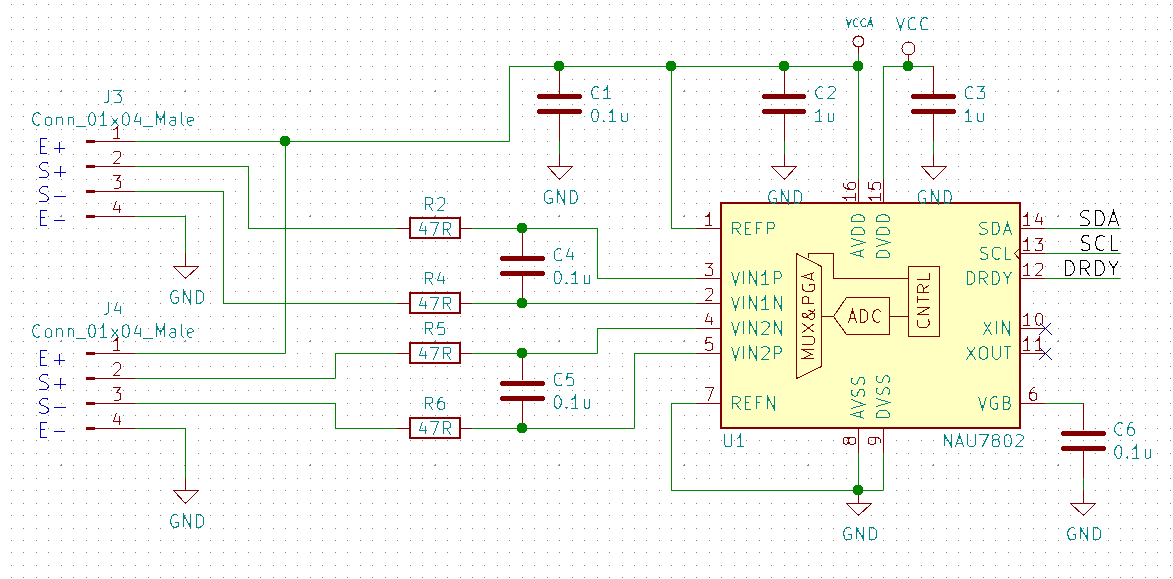
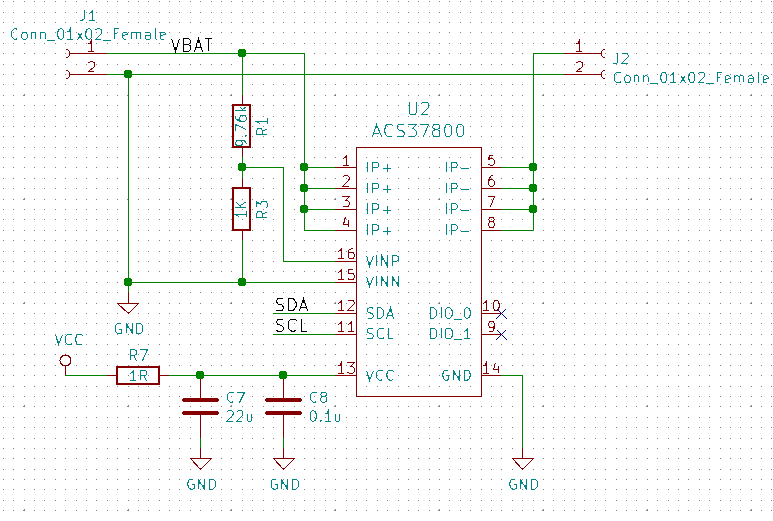
For the RPM sensors we used the same as on the RPM-deck, the QRD1114. They are not great as they need a reflective surface, this means adding white stickers or paint to black propellers, but they work well enough. The load cell amplifiers ended up to be the NAU7802 as it has a high accuracy and sample rate. For power metering we chose the new ACS37800 power monitoring IC that can handle up to 30A, this looked exiting.
The QRD1114 we wired the same way as previously done on the RPM-deck:
The NAU7802 was configured as per the datasheet suggestion and similarly to other open designs out there:
The ACS37800 was very new so the datasheet had to be used as the main information source. A bit tricky as this chip is mainly intended to measure mains supply, and we wanted to measure low voltage DC, which it said it could do…and in the end we managed to get it working.
We also added a buck/boost DC/DC that could provide a stable 3.3V from 2-5V input, just in case, as the ACS37800 is specified for this voltage and not the 3.0V the Crazyflie can supply.
The outcome
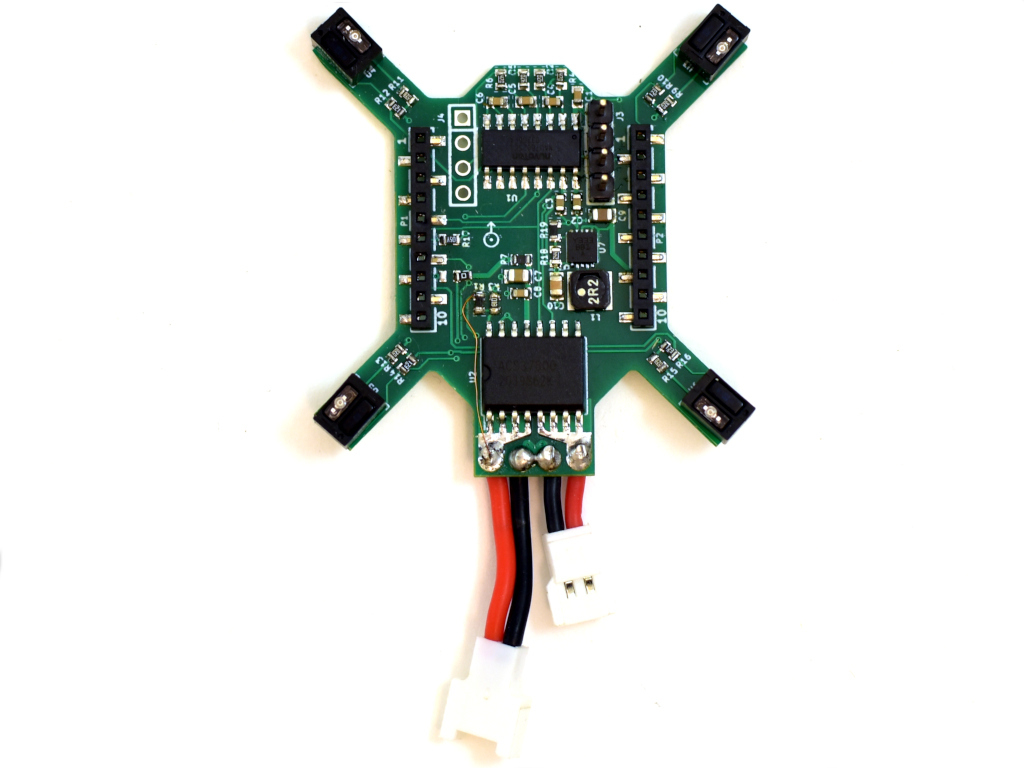
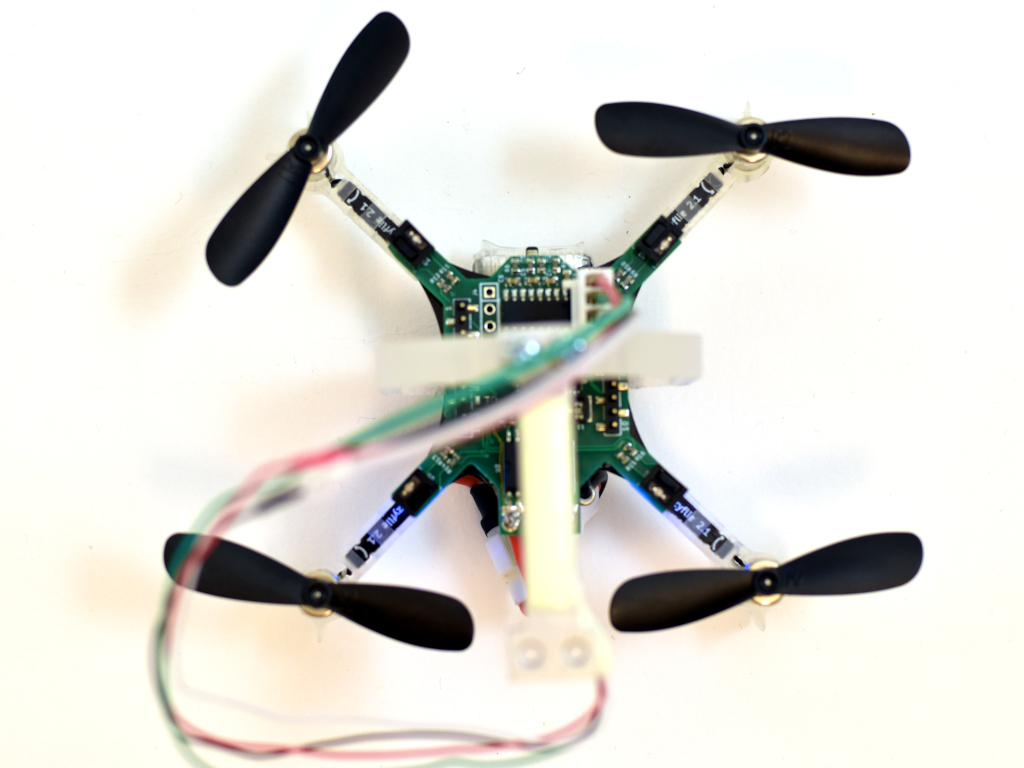
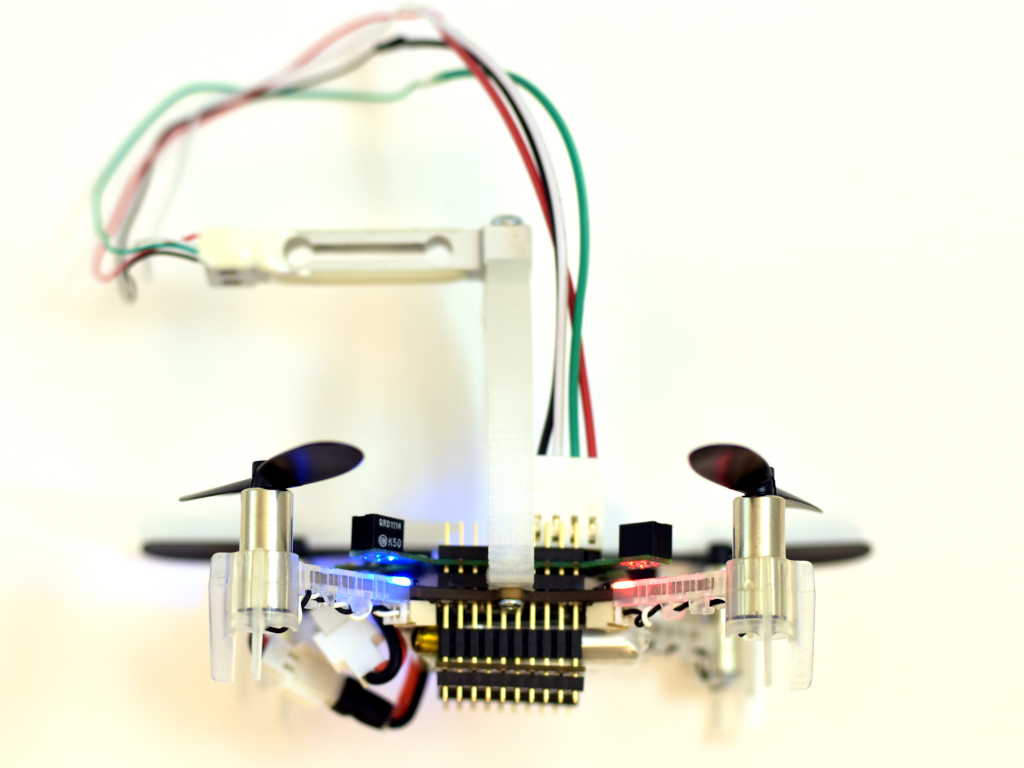
The PCB was designed as small as possible so it could be mounted on a Crazyflie 2.X and used while flying. A bonus would be if it could be used on a Bolt as well.
Here it is mounted on a Crazyflie 2.1 together with a 3D printed stand and load cell.
The load cell would then be mounted to a desk or similar so the the Crazyflie is mounted up-side down, pushing down on the load cell.
Software
The software, as often, took most of the time to make. Three major deck driver files was created, rpm.c, acs37800.c and loadcell_nau7802.c. Aside from these there where only small changes to make, like making it work when being up-side-down. The modifications have all been pushed to the dev-systemid branch for those that are interested. As for now we are mainly using the logging framework to transfer the data to the PC, which is quick and easy to setup and use, but writing to SD-card is also possible. The scripts for this can be found in the tools/sytem_id folder.
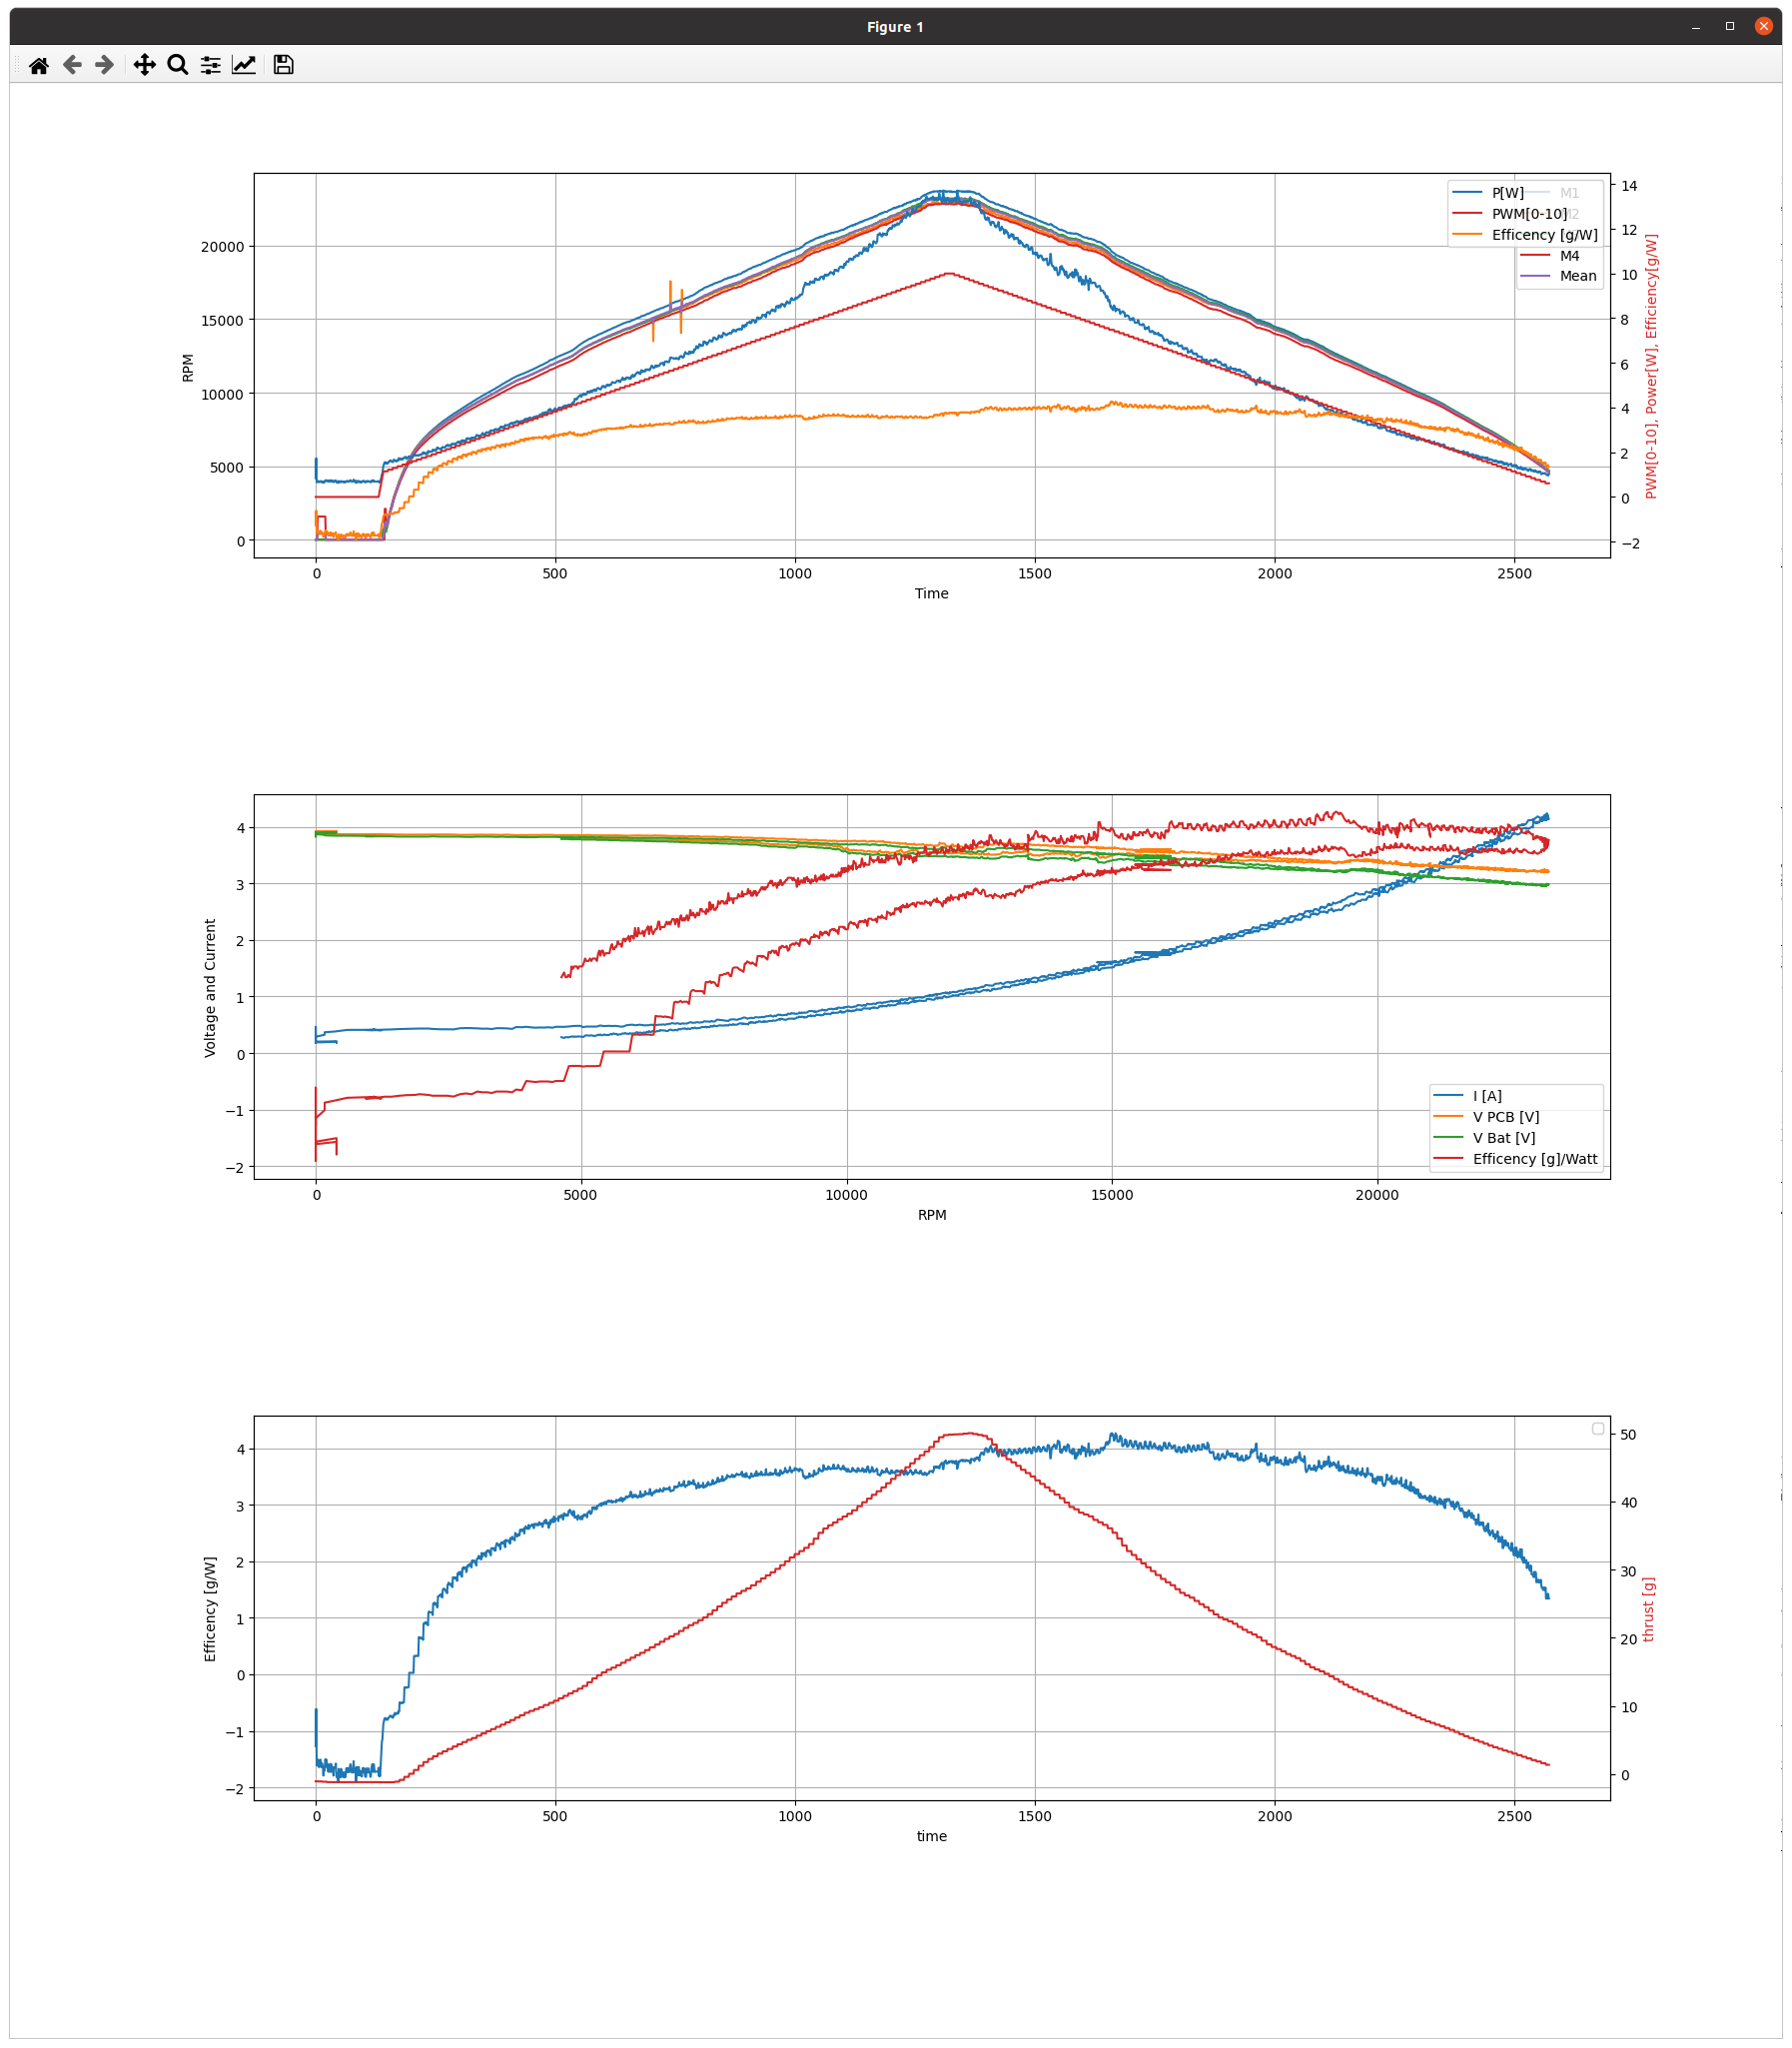
Remaining work is to test, gather and analyse more data. When we have done so, we will post more. Until then below is a sample of what it can measure. The data is taken with a ramping PWM from 0% – 100% – 0%. The added resistance of the extra wires and connectors are not taken into account, but the estimated efficiency of 4g/W is probably not that far off.
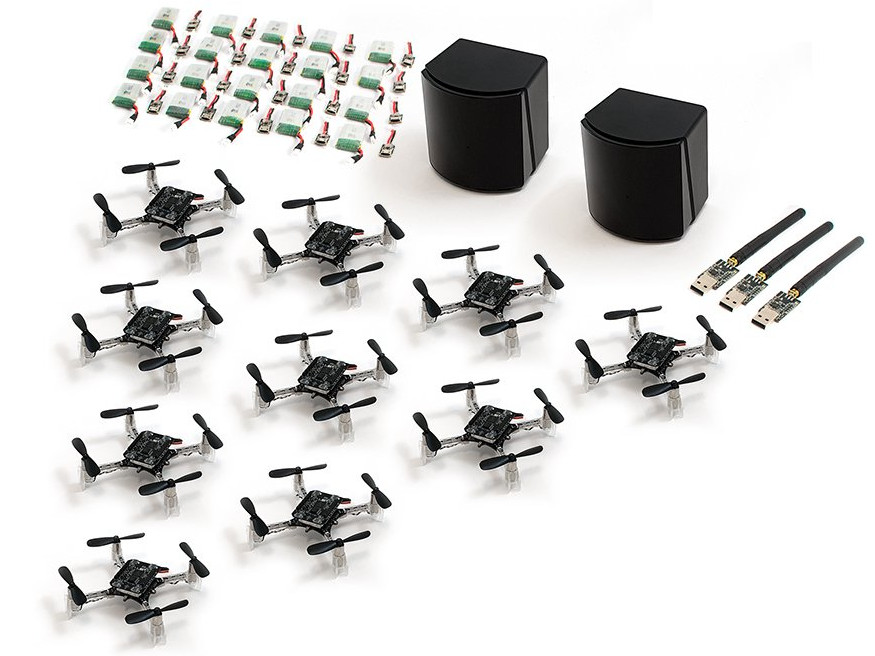
Ever since we released the Lighthouse deck back in 2019, we’ve wanted to offer a bundle with the deck and the base stations. There’s multiple reasons for this, but the main reason was that we wanted users to be able to buy a full swarm (like the Loco Positioning Swarm) directly from us, without having to find the base stations separately. Initially this seemed easy to do, but it turned out to be a bit tricky. This post is about how we finally managed to get the Lighthouse Swarm Bundle finished and into the E-store.
The Lighthouse swarm bundle
When the Lighthouse deck was initially released it only had support for Lighthouse V1 base stations, but Ligthouse V2 was already out. Since the V1 base stations were already in short supply, we wanted to support V2 since this was what would be available in the future. We had started looking at V2 support, but there was still ongoing efforts from us (and others) to reverse engineer the protocol. After some prototyping we had some initial support, but there was still a lot of infrastructure work to be done before it could be released.
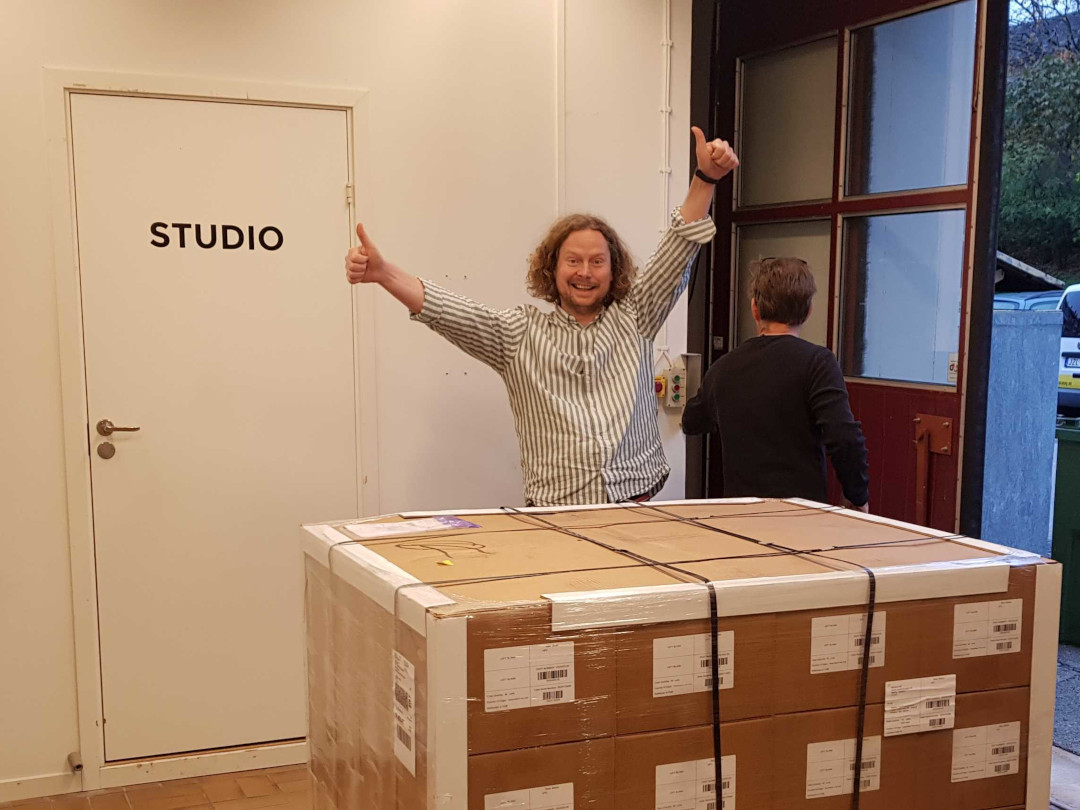
In parallell with this work we started trying to buy the Lighthouse V2 base stations. Normally there’s two options here, either buy from local distributors or buy directly from the manufacturer. Buying from local distributors wasn’t a good option for us since these will only have local power plugs and buying directly from the manufacturer often requires very large orders. So this process quickly stalled. But after a couple of months we got an offer to buy a bulk shipment of Ligthouse V2 base stations (without box or power adapters) which we finally decided to accept. And yeah, that’s me looking really happy next to a bunch of base stations…
Marcus looking happy about the base stations
With a bunch of base stations at the office, work with sourcing a power adapter and creating a box started. Unfortunately the number of COVID-19 cases started rising again shortly after receiving the base stations, so we started working more from home again. And with only 2 persons at the office at a time, it’s hard to work with hardware. Different team-members needs access to different resources, like the electronics labs, flight arena or packing orders. So getting box/adapter samples from manufacturers, doing testing and getting input on physical objects from other team-members quickly went from days to weeks.
Finally, after a couple of months of testing, evaluating and learning lots about adapters and cardboard, we had good candidates. But then, literally as we’re ordering the power adapters, it turns out the certification was not good for all the regions we wanted. Thankfully this time around we already had other options so we quickly decided on the second best option (now the best option) and ordered.
In the meantime work was underway finalizing the implementation of Lighthouse V2, including client support, firmware updates of the Lighthouse deck and documentation/videos. Finally in the beginning of 2021 we got documentation and the full implementation (although only for 2 base stations) in place (blog post).
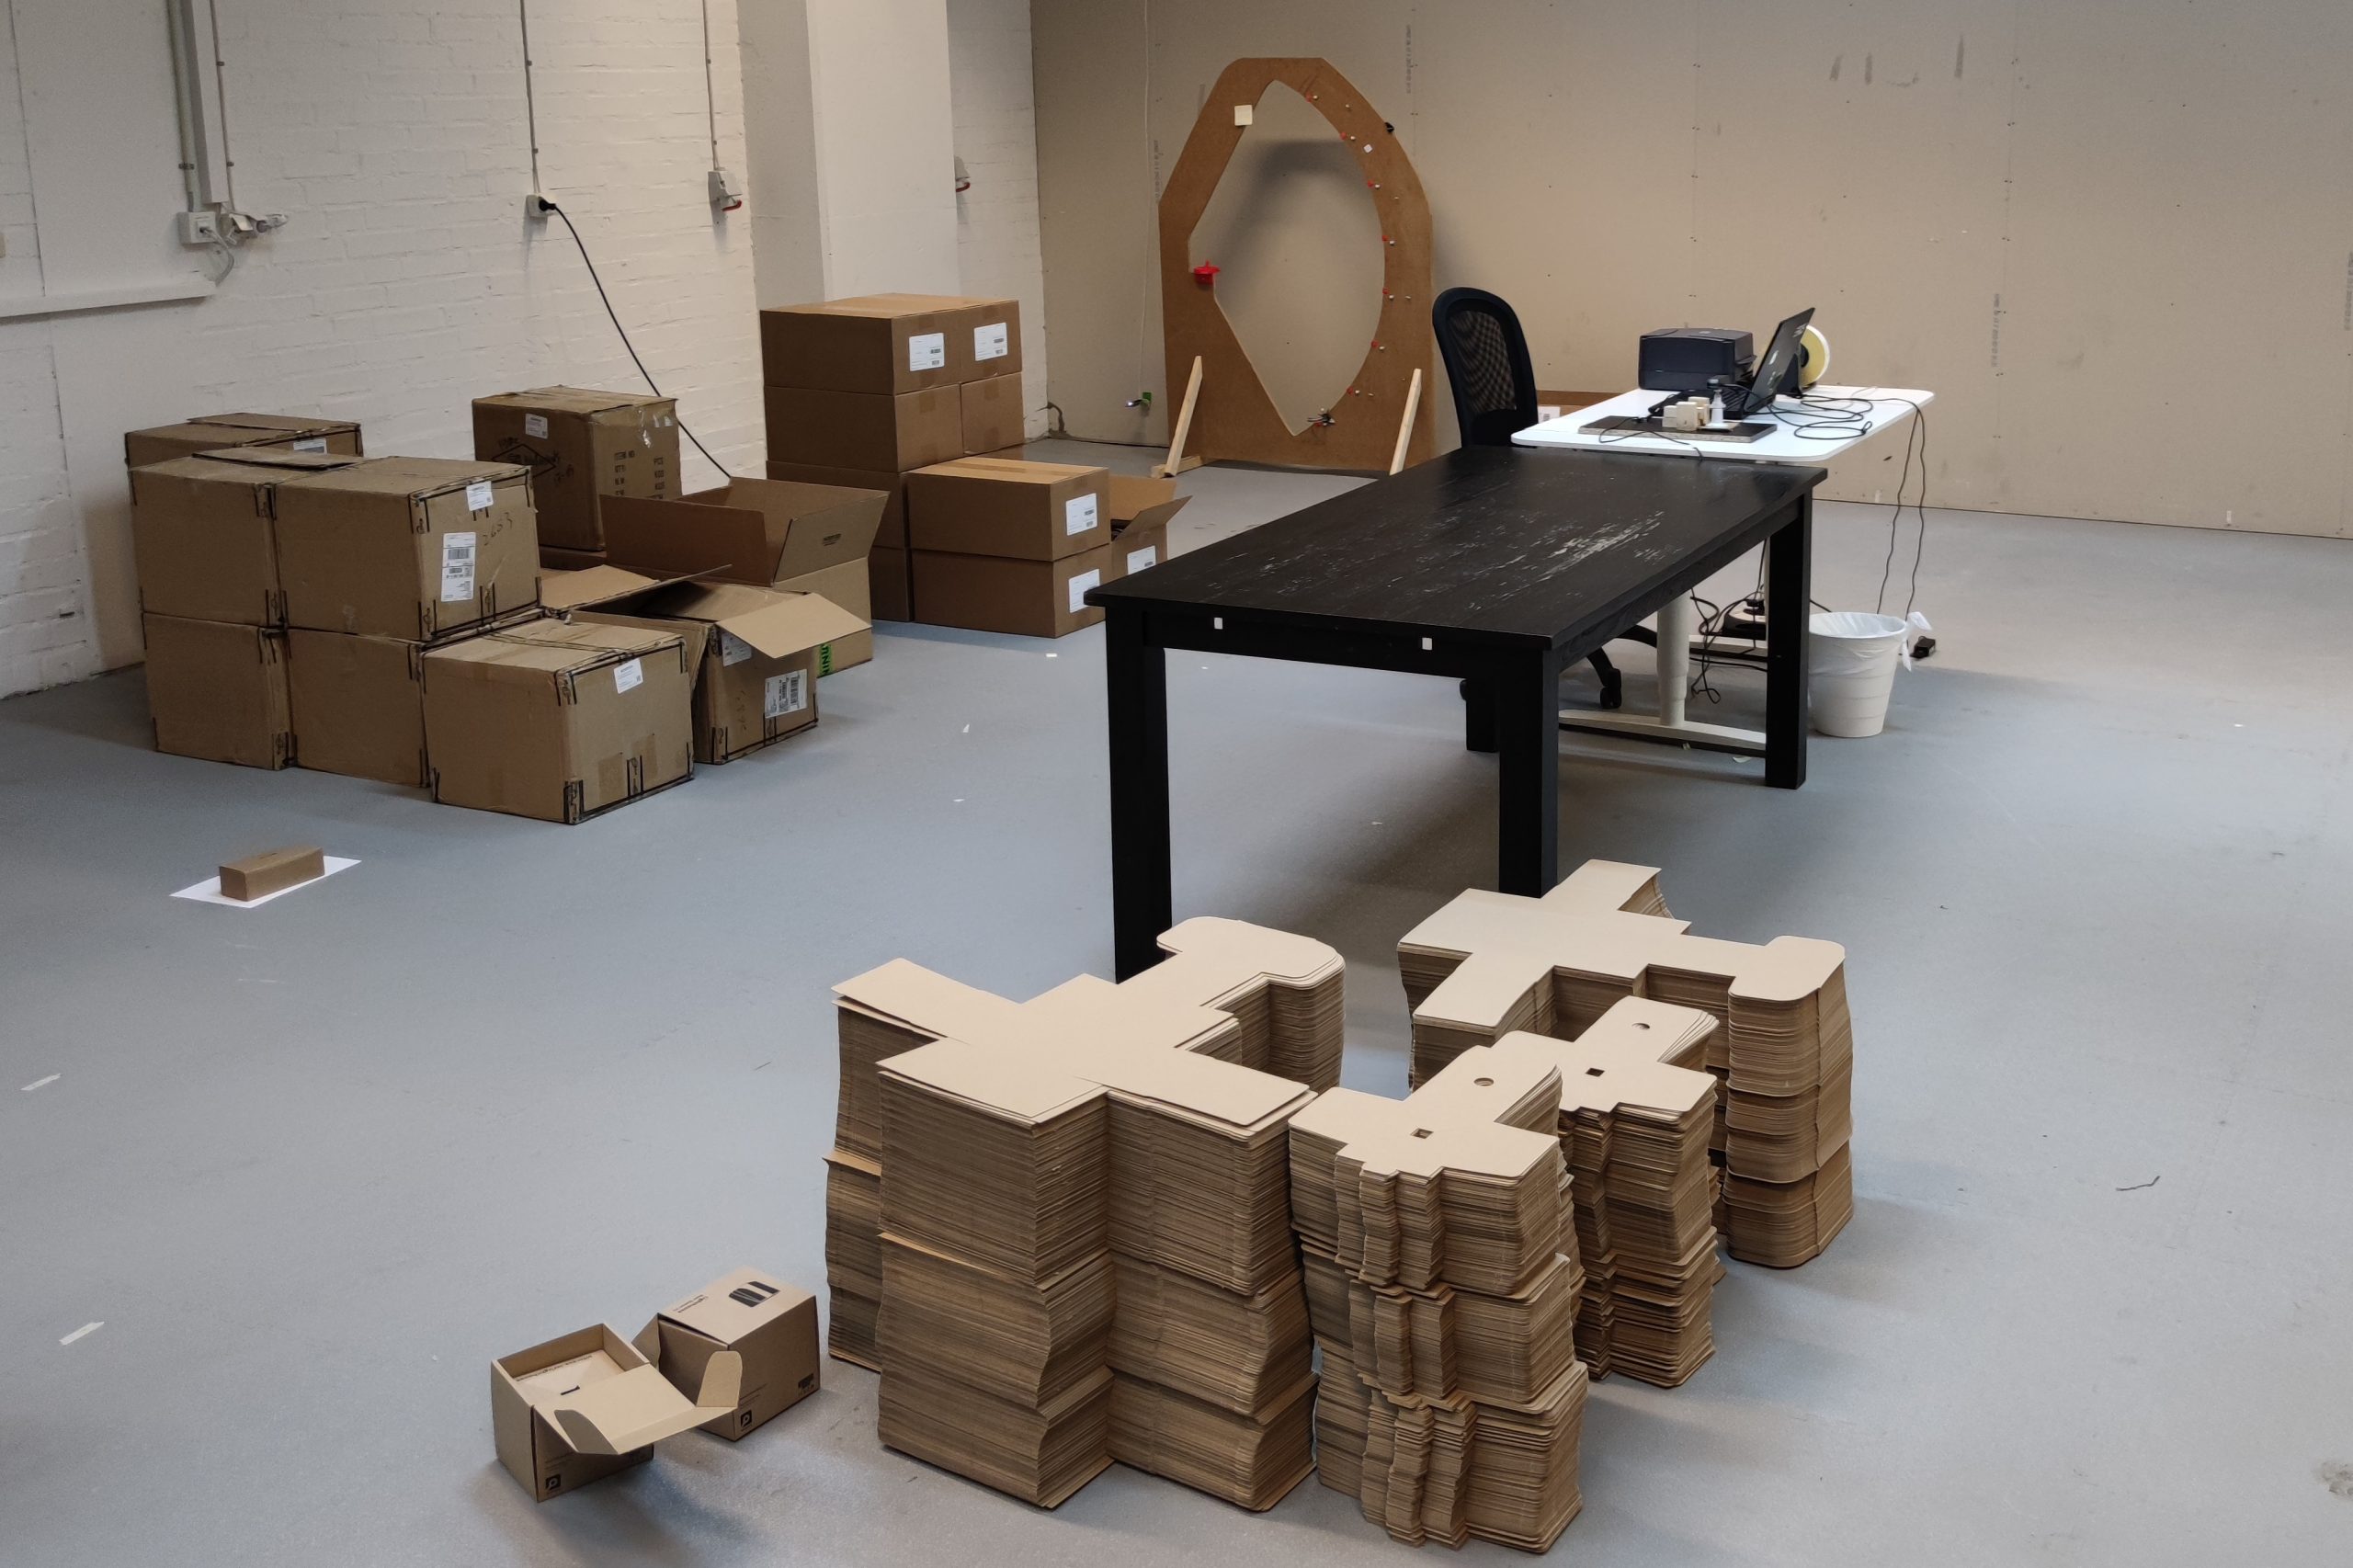
After a bit more than a month of waiting, the power adapters and boxes finally showed up at our office. With all the supplies in place, we started preparing for the packing. Since you can buy base stations for multiple sources, we wanted to keep track of the base stations that we were sending out to be able to debug issues users might have with these units. Also, even though the base stations had already been factory tested, we wanted to quickly test them before shipping them out. So our flight arena was turned into a makeshift assembly line and we had some outside help come in to do the packing.
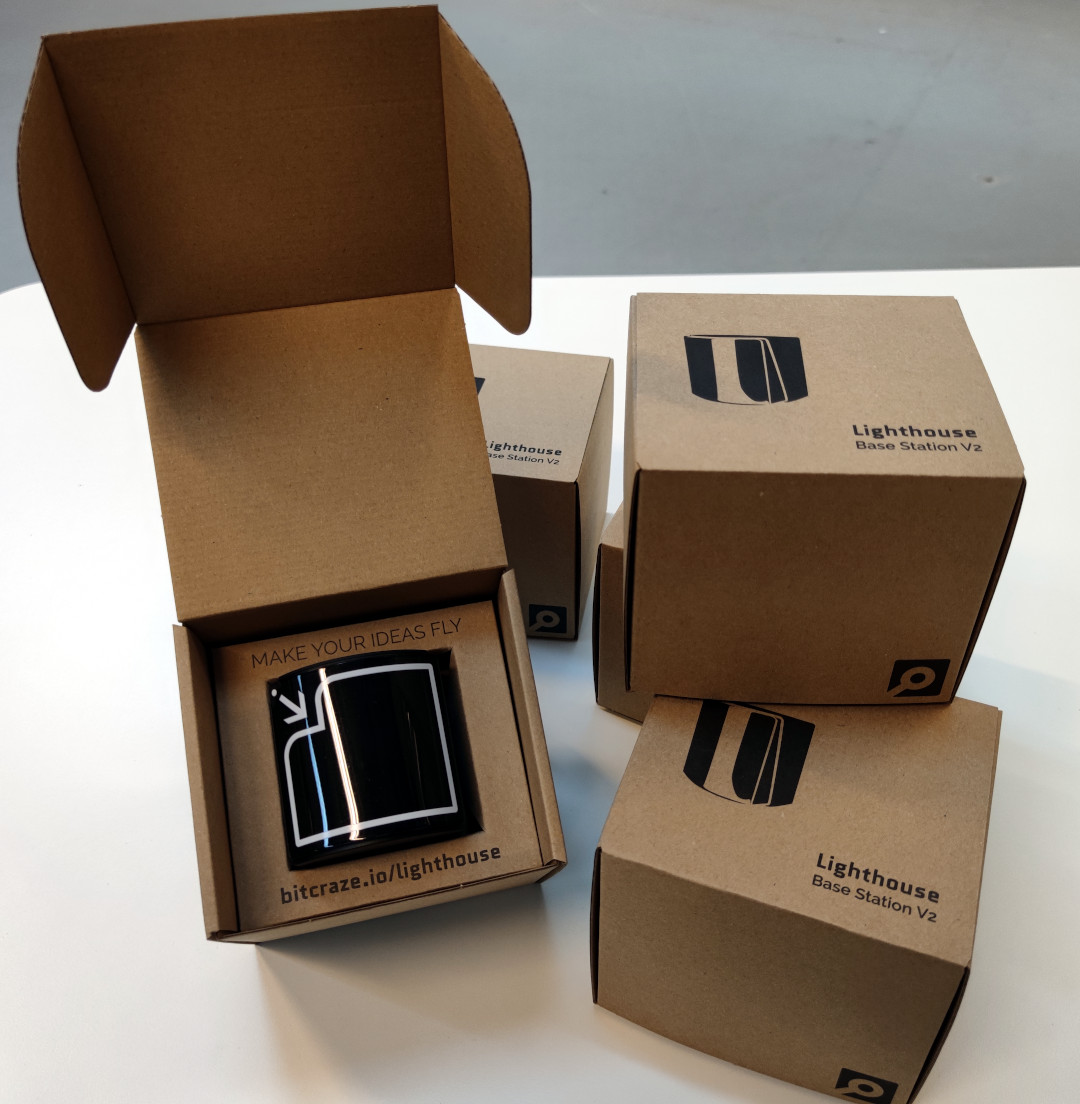
Finally, the end result! We’re really excited to be able to offer yet another swarm bundle, the Lighthouse swarm bundle. And we’re pretty happy about how the packaging turned out :-)
This week we have a guest blog post from Bart Duisterhof and Prof. Guido de Croon from the MAVlab, Faculty of Aerospace Engineering from the Delft University of Technology. Enjoy!
Tiny drones are ideal candidates for fully autonomous jobs that are too dangerous or time-consuming for humans. A commonly shared dream would be to have swarms of such drones help in search-and-rescue scenarios, for instance to localize gas leaks without endangering human lives. Drones like the CrazyFlie are ideal for such tasks, since they are small enough to navigate in narrow spaces, safe, agile, and very inexpensive. However, their small footprint also makes the design of an autonomous swarm extremely challenging, both from a software and hardware perspective.
From a software perspective, it is really challenging to come up with an algorithm capable of autonomous and collaborative navigation within such tight resource constraints. State-of-the-art solutions like SLAM require too much memory and processing power. A promising line of work is to use bug algorithms [1], which can be implemented as computationally efficient finite state machines (FSMs), and can navigate around obstacles without requiring a map.
A downside of using FSMs is that the resulting behavior can be very sensitive to their hyperparameters, and therefore may not generalize outside of the tested environments. This is especially true for the problem of gas source localization (GSL), as wind conditions and obstacle configurations drastically change the problem. In this blog post, we show how we tackled the complex problem of swarm GSL in cluttered environments by using a simple bug algorithm with evolved parameters, and then tested it onboard a fully autonomous swarm of CrazyFlies. We will focus on the problems that were encountered along the way, and the design choices we made as a result. At the end of this post, we will also add a short discussion about the future of nano drones.
Why gas source localization?
Overall we are interested in finding novel ways to enable autonomy on constrained devices, like CrazyFlies. Two years ago, we showed that a swarm of CrazyFlie drones was able to explore unknown, cluttered environments and come back to the base station. Since then, we have been working on an even more complex task: using such a swarm for Gas Source Localization (GSL).
There has been a lot of research focussing on autonomous GSL in robotics, since it is an important but very hard problem. The difficulty of the task comes from the complexity of how odor can spread in an environment. In an empty room without wind, a gas will slowly diffuse from the source. This can allow a robot to find it by moving up gradient, just like small bacteria like E. Coli do. However, if the environment becomes larger with many obstacles and walls, and wind comes into play, the spreading of gas is much less regular. Large parts of the environment may have no gas or wind at all, while at the same time there may be pockets of gas away from the source. Moreover, chemical sensors for robots are much less capable than the smelling organs of animals. Available chemical sensors for robots are typically less sensitive, noisier, and much slower.
Due to these difficulties, most work in the GSL field has focused on a single robot that has to find a gas source in environments that are relatively small and without obstacles. Relatively recently, there have been studies in which groups of robots solve this task in a collaborative fashion, for example with Particle Swarm Optimization (PSO). This allows robots to find the source and escape local maxima when present. Until now this concept has been shown in simulation [2] and on large outdoor drones equipped with LiDAR and GPS [3], but never before on tiny drones in complex, GPS-denied, indoor environments.
Required Infrastructure
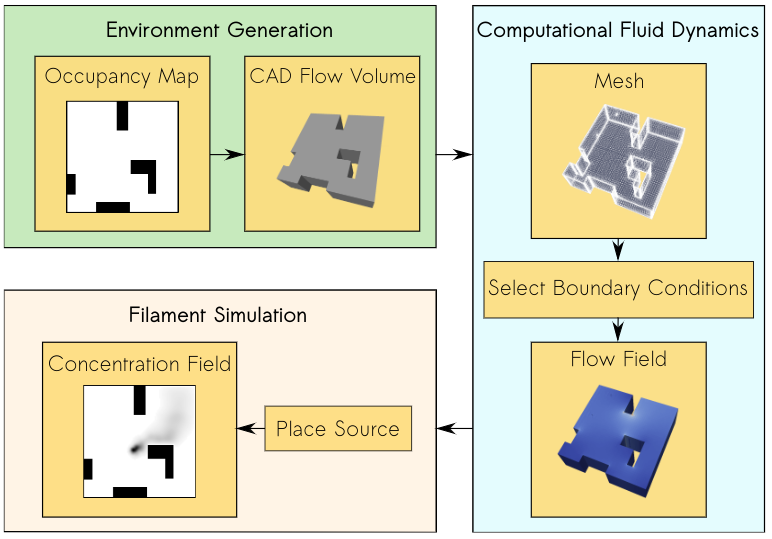
In our project, we introduce a new bug algorithm, Sniffy Bug, which uses PSO for gas source localization. In order to tune the FSM of Sniffy Bug, we used an artificial evolution. For time reasons, evolution typically takes place in simulation. However, early in the project, we realized that this would be a challenge, as no end-to-end gas modeling pipeline existed yet. It is important to have an easy-to-use pipeline that does not require any aerodynamics domain knowledge, such that as many researchers as possible can generate environments to test their algorithms. It would also make it easier to compare contributions and to better understand in which conditions certain algorithms work or don’t work. The GADEN ROS package [4] is a great open-source tool for modeling gas distribution when you have an environment and flow field, but for our objective, we needed a fully automated tool that could generate a great variety of random environments on-demand with just a few parameters. Below is an overview of our simulation pipeline: AutoGDM.
AutoGDM, a fully automated gas dispersion modeling (GDM) simulation pipeline.
First, we use a procedural environment generator proposed in [5] to generate random walls and obstacles inside of the environment. An important next step is to generate a 3D flowfield by means of computational fluid dynamics (CFD). A hard requirement for us was that AutoGDM needed to be free to use, so we chose to use the open-source CFD tool OpenFOAM. It’s used for cutting-edge aerodynamics research, and also the tool suggested by the authors of GADEN. Usually, using OpenFOAM isn’t trivial, as a large number of parameters need to be selected that require field expertise, resulting in a complicated process. Next, we integrate GADEN into our pipeline, to go from environment definition (CAD files) and a flow field to a gas concentration field. Other parts that needed to be automated were the random selection of boundary conditions, which has a large impact on the actual flow field, and source placement, which has an equally large impact on the concentration field.
After we built this pipeline, we started looking for a robot simulator to couple it to. Since we weren’t planning on using a camera, our main requirement was for the simulator to be efficient (preferably in 2D) so that evolutions would take relatively little time. We decided to use Swarmulator [6], a lightweight C++ robot simulator designed for swarming and we plugged in our gas data.
Algorithm Design
Roughly speaking, we considered two categories of algorithms for controlling the drones: 1) a neural network, and 2) an FSM that included PSO, with evolved parameters. Since we used a tiny neural network for light seeking with a CrazyFlie in our previous work, we first evolved neural networks in simulation. One of the first experiments is shown below.
A single agent in simulation seeking a light source using a tiny neural network.
While it worked pretty well in simple environments with few obstacles, it seemed challenging to make this work in real life with complex obstacles and multiple agents that need to collaborate. Given the time constraints of the project, we have opted for evolving the FSM. This also facilitated crossing the reality gap, as the simulated evolution could build on basic behaviors that we developed and validated on the real platform, including obstacle avoidance with four tiny laser rangers, while communicating with and avoiding other drones. An additional advantage of PSO with respect to the reality gap is that it only needs gas concentration and no gradient of the gas concentration or wind direction (which many algorithms in literature use). On a real robot at this scale, estimating the gas concentration gradient or the direction of a light breeze is hard if not impossible.
Hardware
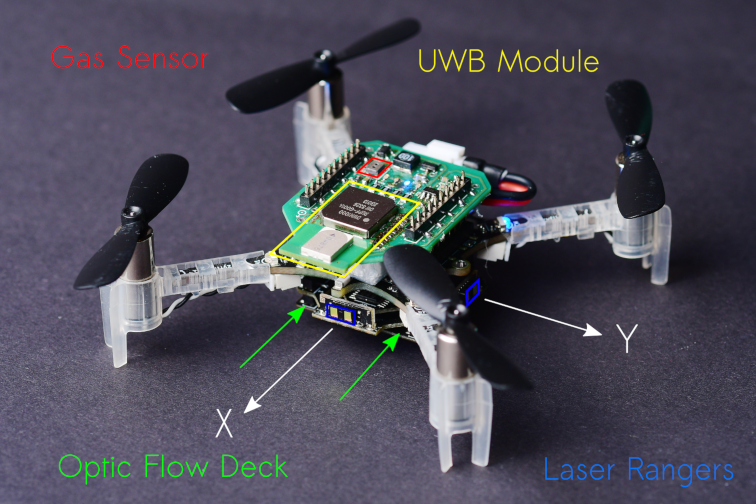
Our CrazyFlie needs to be able to avoid obstacles, execute velocity commands, sense gas, and estimate the other agent’s position in its own frame. For navigation, we added the flow deck and laser rangers, whereas for gas sensing we used a TGS8100 gas sensor that was used on a CrazyFlie before in previous work [7]. The sensor is lightweight and inexpensive, but accurately estimating gas concentrations can be difficult because of its size. It tends to drift and needs time to recover after a spike in concentration is observed. Another thing we noticed is that it is possible to break them, a crash can definitely destroy the sensor.
To estimate the relative position between agents, we use a Decawave Ultra-Wideband (UWB) module and communicate states, as proposed in [8]. We also use the UWB module to communicate gas information between agents and collaboratively seek the source. The complete configuration is visible below.
A 37.5 g nano quadcopter, capable of fully autonomous waypoint tracking, obstacle avoidance, relative localization, communication and gas sensing.
Evaluation in Simulation
After we optimized the parameters of our model using Swarmulator and AutoGDM, and of course trying many different versions of our algorithm, we ended up with the final Sniffy Bug algorithm. Below is a video that shows evolved Sniffy Bug evaluated in six different environments. The red dots are an agent’s personal target waypoint, whereas the yellow dot is the best-known position for the swarm.
Sniffy Bug evaluated in Swarmulator environments.
Simulation showed that Sniffy Bug is effective at locating the gas source in randomly generated environments. The drones successfully collaborate by means of PSO.
Real Flight Testing
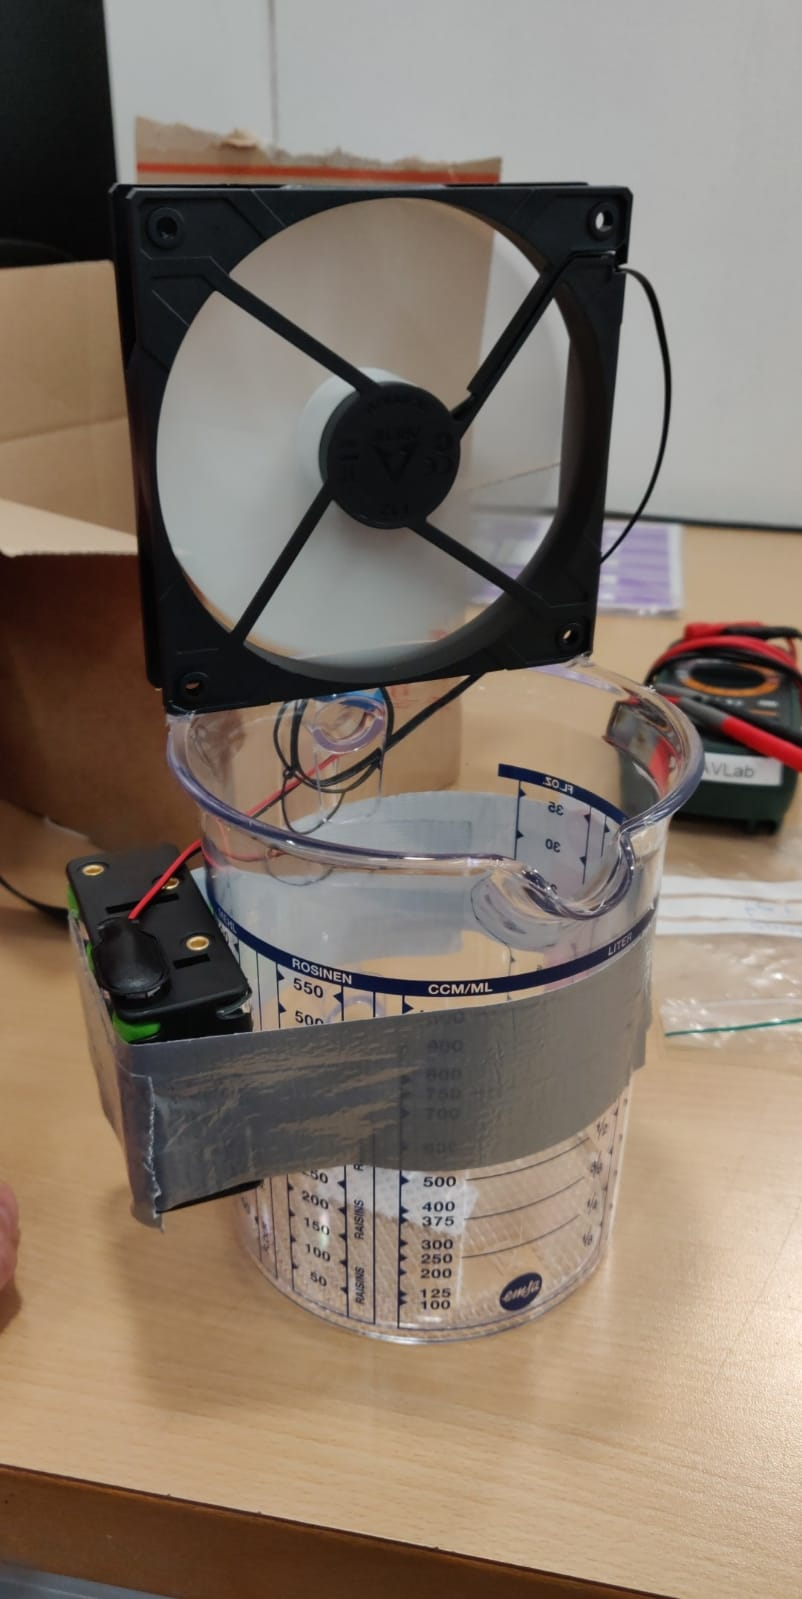
After observing Sniffy Bug in simulation we were optimistic, but unsure about performance in real life. First, inspired by previous works, we disperse alcohol through the air by placing liquid alcohol into a can which is then dispersed using a computer fan.
Dispersion of liquid alcohol in flight tests.
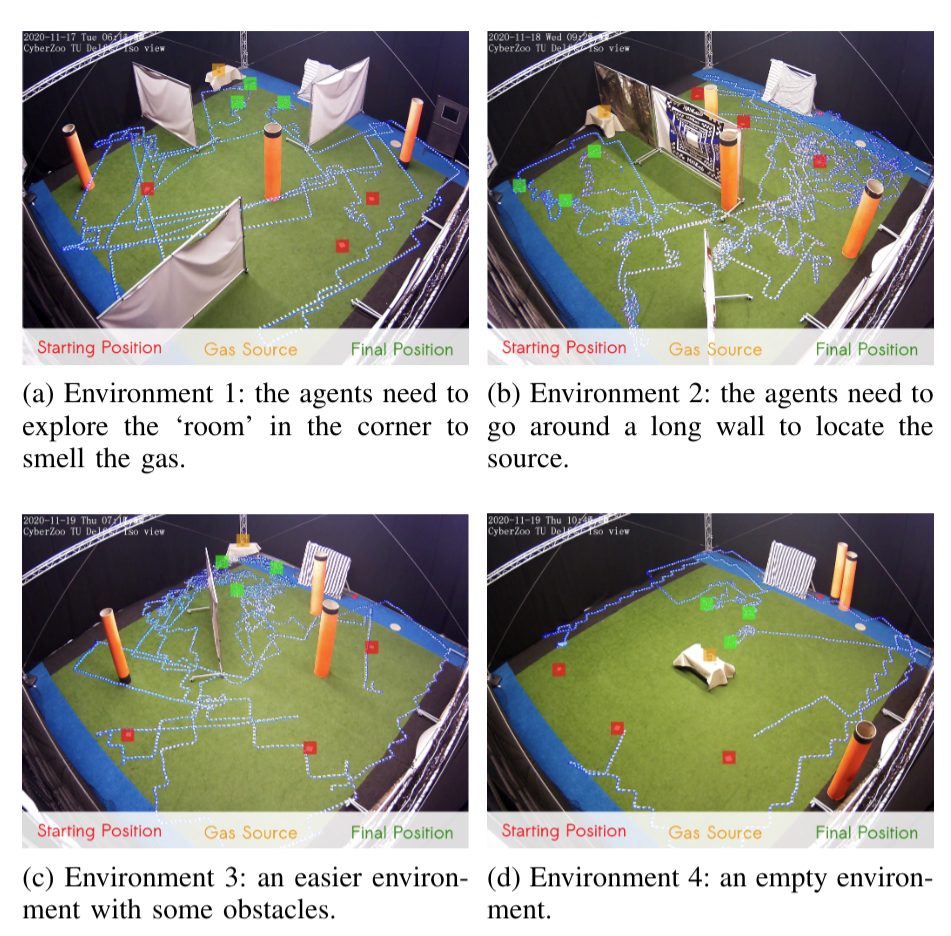
We test Sniffy Bug in our flight arena of size 10 x 10 meters with large obstacles that are shaped like walls and orange poles. The image below shows four flight tests of Sniffy Bug in cluttered environments, flying fully autonomously, i.e., without the help from any external infrastructure.
Time-lapse images of real-world experiments in our flight arena. Sniffy was evaluated on four distinct environments, 10 x 10 meters in size, seeking a real isopropyl alcohol source. The trajectories of the nano quadcopters are clearly visible due to their blue lights.
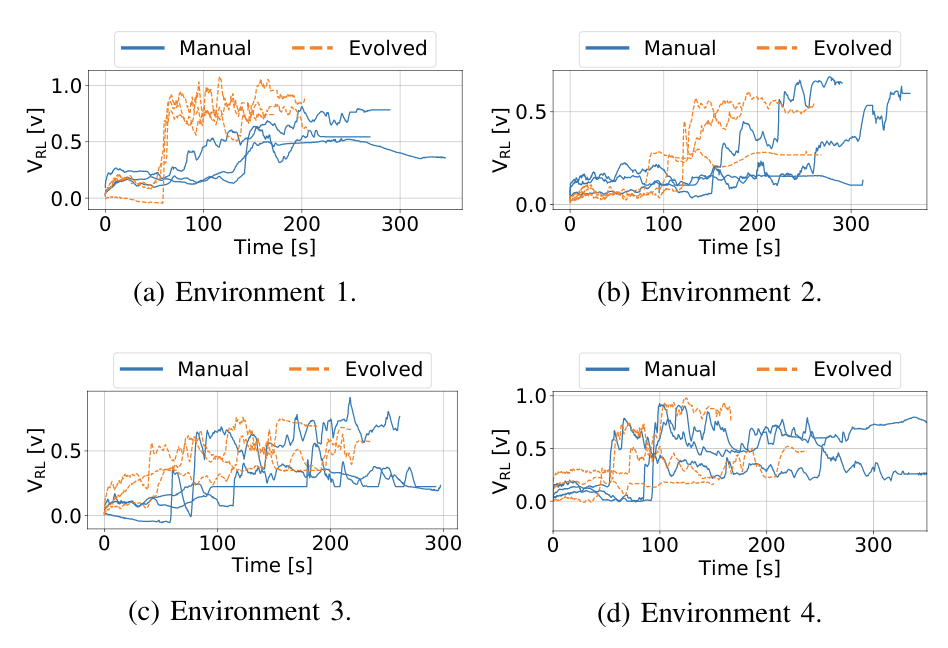
In the total of 24 runs we executed, we compared Sniffy Bug with manually selected and evolved parameters. The figure below shows that the evolved parameters are more efficient in locating the source as compared to the manual parameters.
Maximum recorded gas reading by the swarm, for each time step for each run.
This does not only show that our system can successfully locate a gas source in challenging environments, but it also demonstrates the usefulness of the simulation pipeline. The parameters that were learned in simulation yield a high-performance model, validating the environment generation, randomization, and gas modeling parts of our pipeline.
Conclusion and Discussion
With this work, we believe we have made an important step towards swarms of gas-seeking drones. The proposed solution is shown to work in real flight tests with obstacles, and without any external systems to help in localization or communication. We believe this methodology can be extended to larger environments or even to 3 dimensions, since PSO is a robust, multi-dimensional heuristic search method. Moreover, we hope that AutoGDM will help the community to better compare gas seeking algorithms, and to more easily learn parameters or models in simulation, and deploy them in the real world.
To improve Sniffy Bug’s performance, adding more laser rangers will definitely help. When working with only four laser rangers you realize how little information it actually provides. If one of the rangers senses a low value it is unclear if a slim pole or a massive wall is detected, adding inefficiency to the algorithm. Adding more laser rangers or using other sensor modalities like vision will help to avoid also more complex obstacles than walls and poles in a reliable manner.
Another interesting discussion can be held on the hardware required for real deployment. When working with 40 grams of maximum take-off weight, the sensors and actuators that can be selected are limited. For example, the low-power and lightweight flow deck works great but fails in low-light scenarios or with smoke. Future work exploring novel sensors for highly constrained nano robots could really help increase the Technological Readiness Level (TRL) of these systems.
Finally, this has been a really fun project to work on for us and we can’t wait to hear your thoughts on Sniffy Bug!